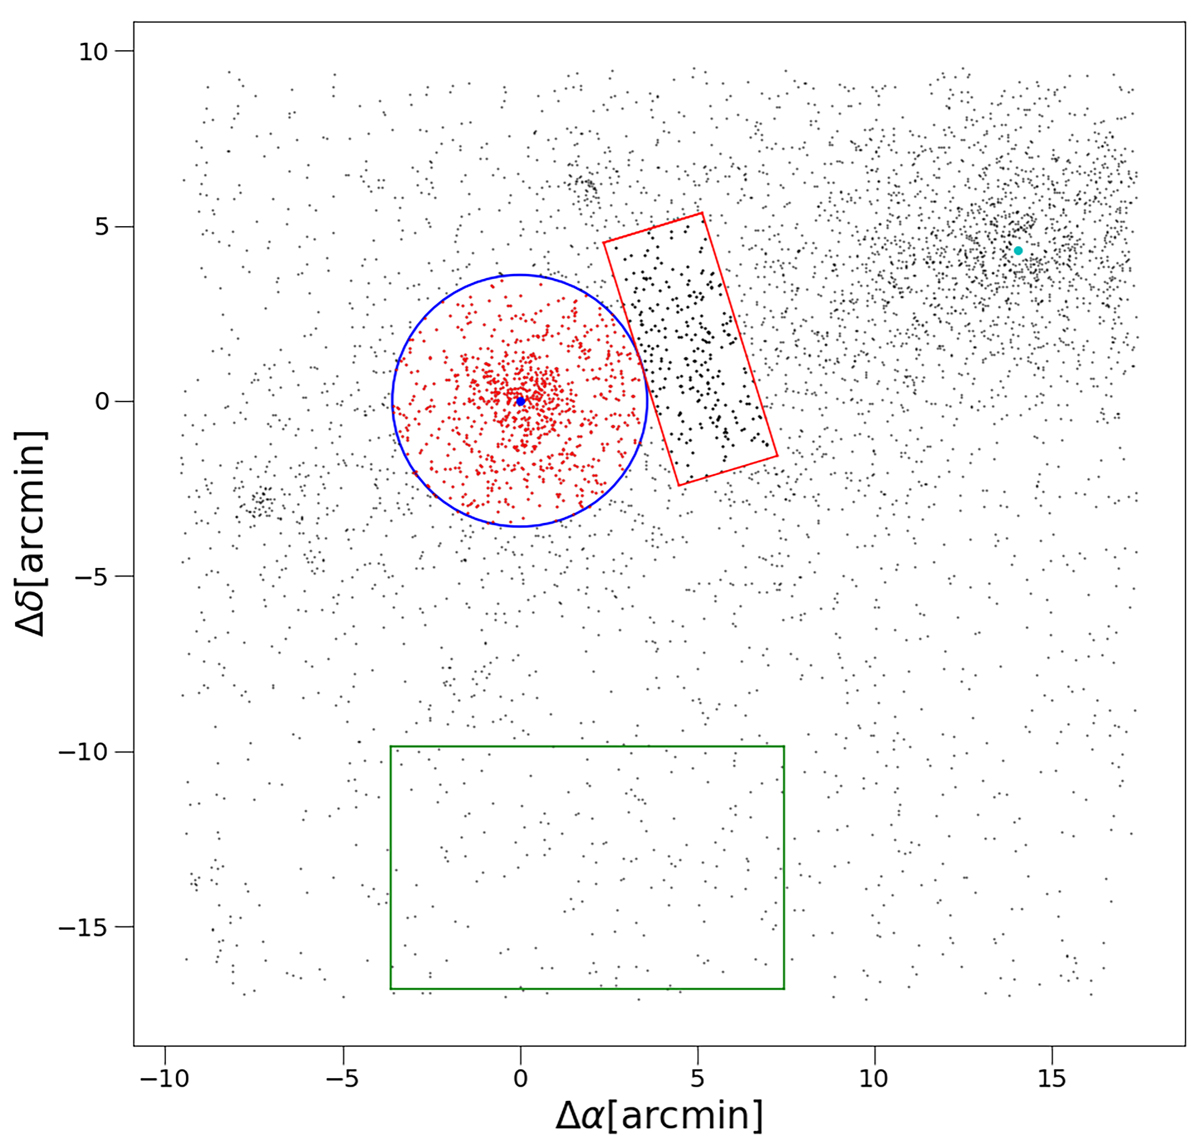
Fig. 3.
Download original image
Positions of the GC candidates with respect to the center of the galaxy. The plot shows the declination and right ascension of the sources, where the center of NGC 4709 (blue point) is located at (Δδ, Δα)=(0, 0). The blue circle defines the limit used to define the GCS of NGC 4709. The green rectangle represents the ∼77.22 arcmin2 region where the contamination level from background objects was calculated, the cyan point is the position of the center of NGC 4696, and the red rectangle is the ∼20.89 arcmin2 region between NGC 4709 and NGC 4696 for which we calculated the luminosity function in Sect. 7. The field-of-view is of 26.91 × 26.40 arcmin2.
Current usage metrics show cumulative count of Article Views (full-text article views including HTML views, PDF and ePub downloads, according to the available data) and Abstracts Views on Vision4Press platform.
Data correspond to usage on the plateform after 2015. The current usage metrics is available 48-96 hours after online publication and is updated daily on week days.
Initial download of the metrics may take a while.