Fig. 4.
Download original image
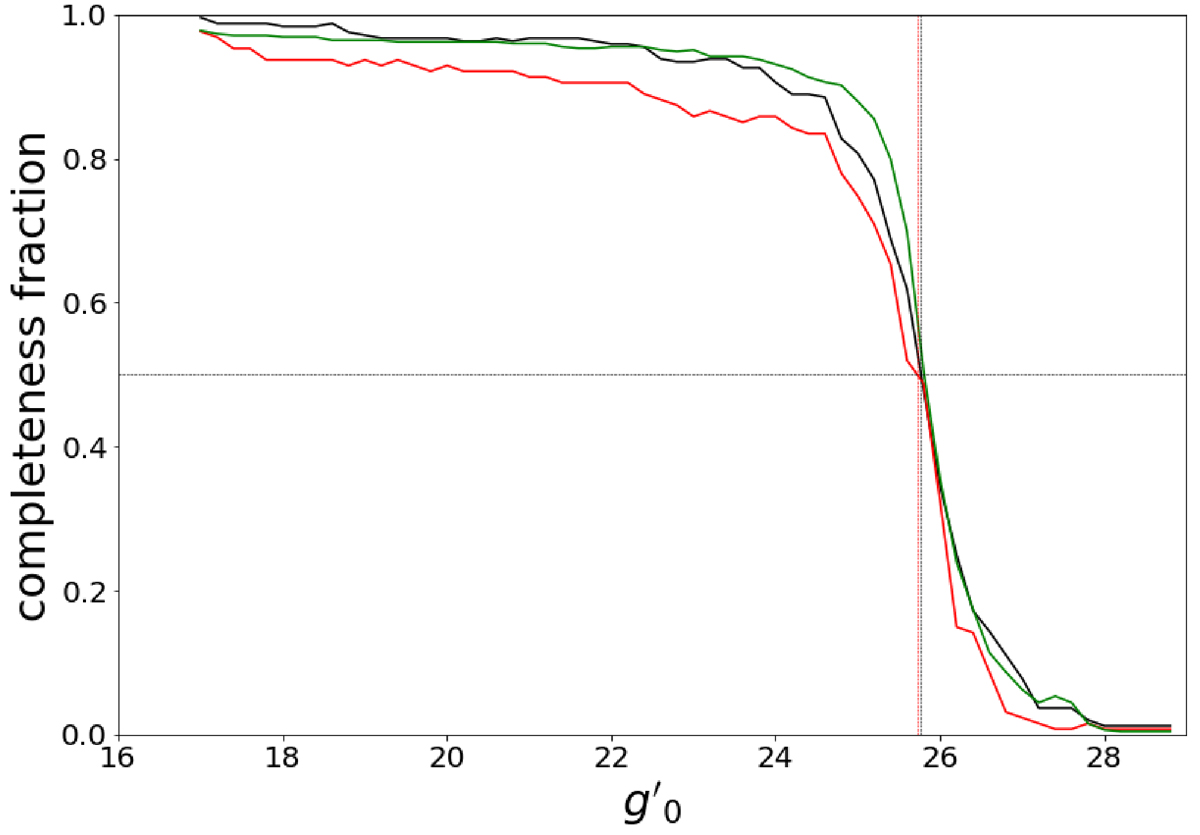
Completeness test. The plot shows the completeness fraction as a function of the g′0 magnitude for the artificial stars added in the three filters inside a galactocentric radius of 5 × reff (black line), for the artificial stars inside the rectangular region used to estimate the background contamination (green line), and inside the region between NGC 4709 and NGC 4696 (red line) represented by the red rectangle in Fig. 3. The dashed lines show the 50% completeness limit.
Current usage metrics show cumulative count of Article Views (full-text article views including HTML views, PDF and ePub downloads, according to the available data) and Abstracts Views on Vision4Press platform.
Data correspond to usage on the plateform after 2015. The current usage metrics is available 48-96 hours after online publication and is updated daily on week days.
Initial download of the metrics may take a while.