Fig. C.1.
Download original image
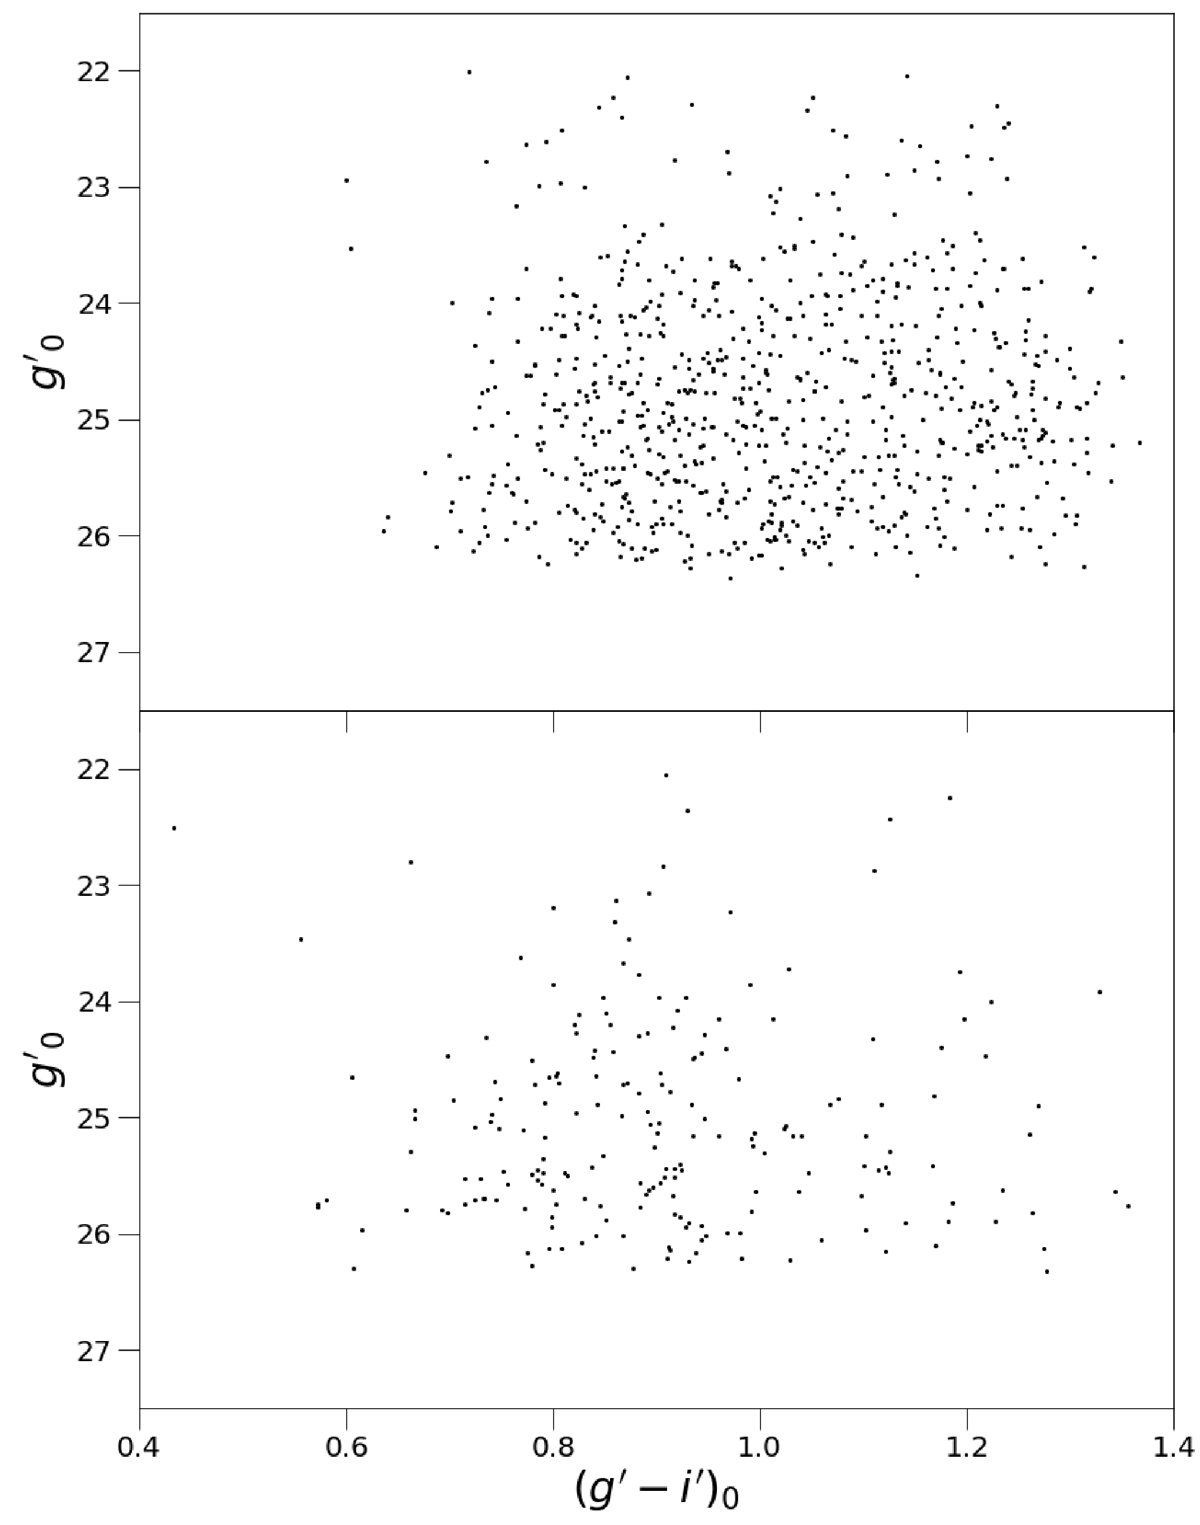
Comparison between the color-magnitude diagram of the GC candidates of NGC 4709 and that of the region between NGC 4709 and NGC 4696. Top panel: Color-magnitude diagram of the 785 GC candidates within a galactocentric distance of 5 × reff from the center of NGC 4709. Bottom panel: Color-magnitude diagram of the 202 GC candidates in the ∼20.89 arcmin2 region between NGC 4709 and NGC 4696.
Current usage metrics show cumulative count of Article Views (full-text article views including HTML views, PDF and ePub downloads, according to the available data) and Abstracts Views on Vision4Press platform.
Data correspond to usage on the plateform after 2015. The current usage metrics is available 48-96 hours after online publication and is updated daily on week days.
Initial download of the metrics may take a while.