Fig. D.1.
Download original image
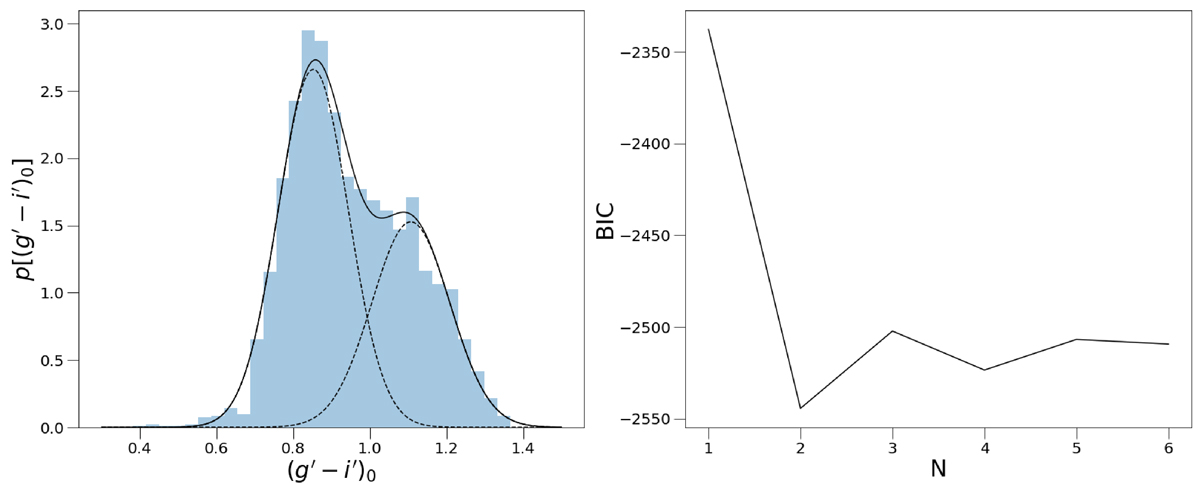
Bayesian Information Criterion in Field 1. Left Panel: probability density function vs the (g′−i′)0 color. The black line represents the best-fit model, and the dashed lines represent the Gaussians described by the model. The color distribution is divided in bins according to the Freedman-Diaconis rule (Freedman & Diaconis 1981). Right panel: values of the BIC as a function of the number of components in the model.
Current usage metrics show cumulative count of Article Views (full-text article views including HTML views, PDF and ePub downloads, according to the available data) and Abstracts Views on Vision4Press platform.
Data correspond to usage on the plateform after 2015. The current usage metrics is available 48-96 hours after online publication and is updated daily on week days.
Initial download of the metrics may take a while.