Fig. 1
Download original image
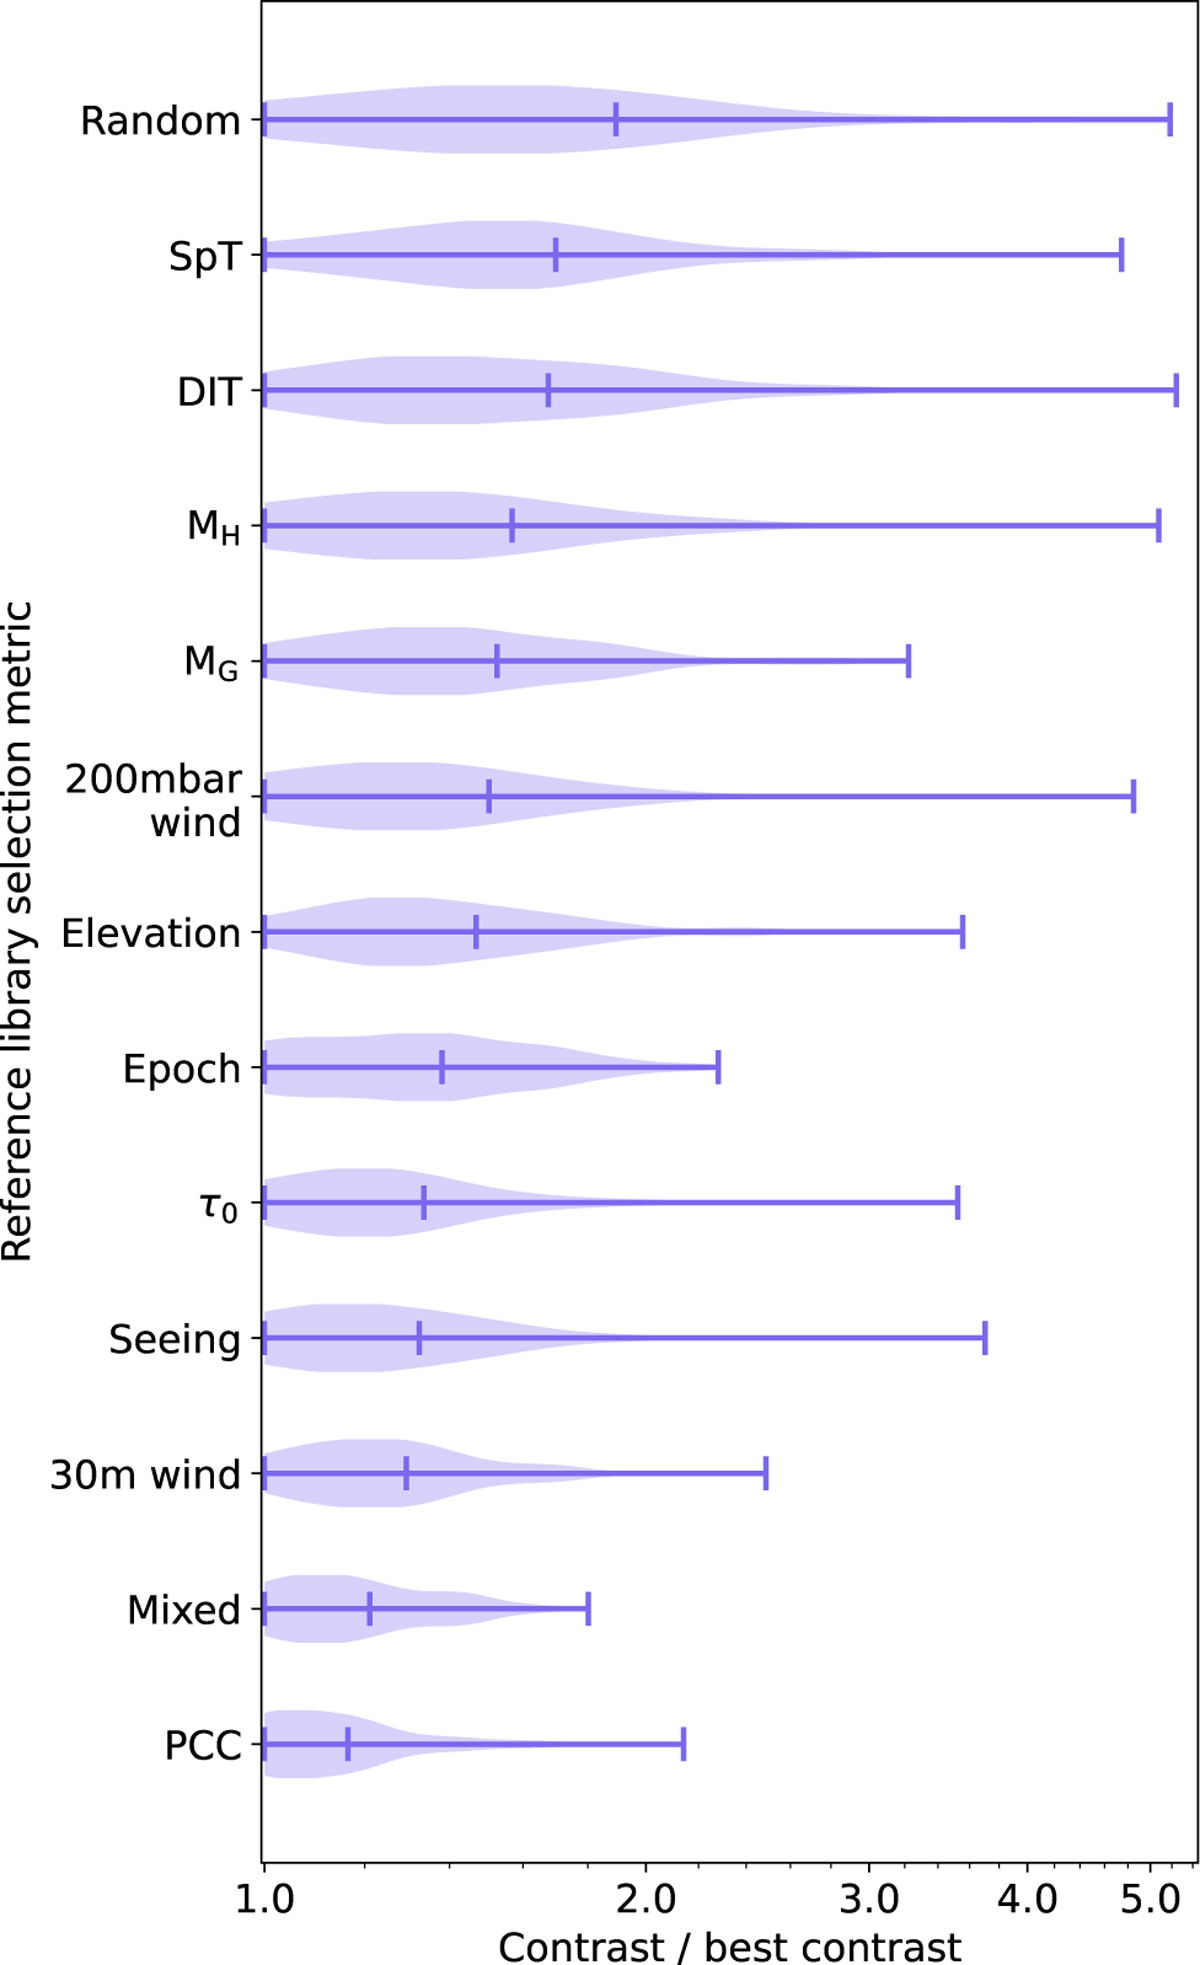
Violin plot showing the contrast distribution of each reference library selection metric for all science targets, disc radii, and widths. The contrast was normalised by that of the parameter library giving the best performance under the same measurement conditions. The vertical lines of the violin show the minimum, mean, and maximum values. Reference library selection metrics are ordered from top to bottom by descending mean.
Current usage metrics show cumulative count of Article Views (full-text article views including HTML views, PDF and ePub downloads, according to the available data) and Abstracts Views on Vision4Press platform.
Data correspond to usage on the plateform after 2015. The current usage metrics is available 48-96 hours after online publication and is updated daily on week days.
Initial download of the metrics may take a while.