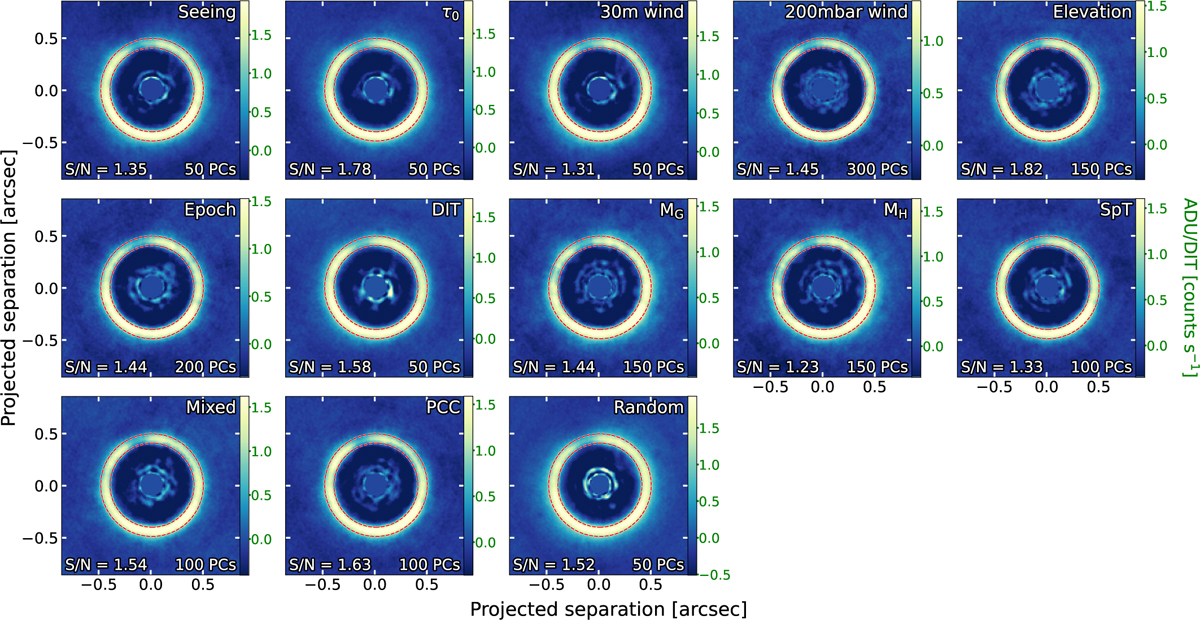
Fig. B.1
Download original image
2MASS J16042165-2130284 2015-06-09 IRDIS-K12 RDI-PCA reductions using the different reference libraries. The reduction with the best S/N is shown for each library. Each image is labelled with the selection metric of the reference library (top right), the number of PCs used (bottom right), and the mean S/N of the disc (bottom left). The region in which the S/N was measured is indicated by the red dashed lines.
Current usage metrics show cumulative count of Article Views (full-text article views including HTML views, PDF and ePub downloads, according to the available data) and Abstracts Views on Vision4Press platform.
Data correspond to usage on the plateform after 2015. The current usage metrics is available 48-96 hours after online publication and is updated daily on week days.
Initial download of the metrics may take a while.