Fig. 12.
Download original image
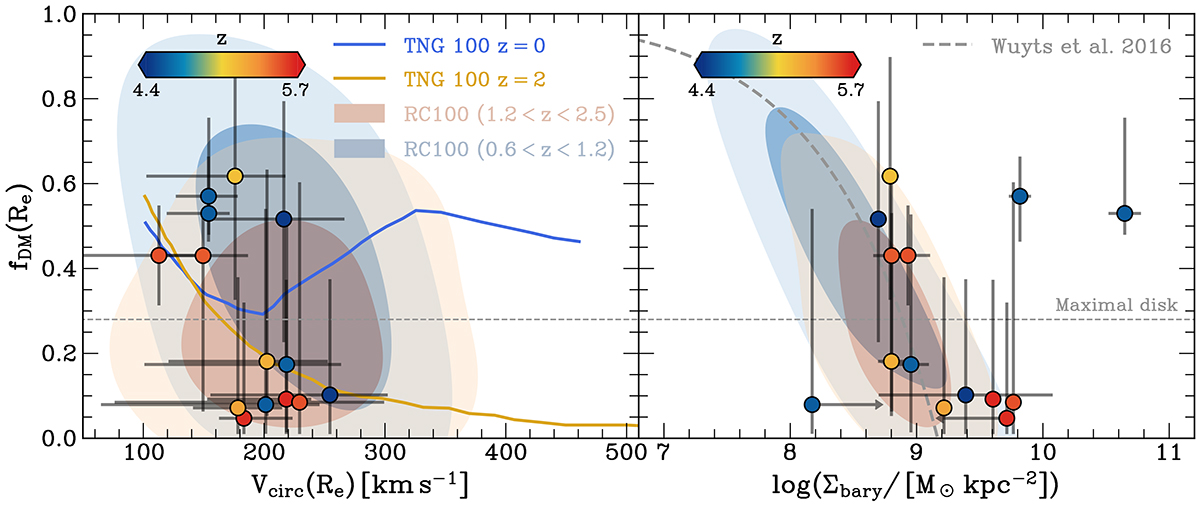
DM fraction, fDM, as a function of the circular velocity at the effective radius, Vcirc(Re) (left), and baryonic surface density, Σbary (right). The yellow and blue curves show the TNG100 (without adiabatic contraction) relations at z = 0 and z = 2 (Lovell et al. 2018), respectively. The pale blue and red shadings are measurements from RC100 at z < 1.2 and z < 2.5, respectively (Nestor Shachar et al. 2023). The thick grey dashed curve is the best-fit relation of z ∼ 2 star-forming galaxies from Wuyts et al. (2016). The CRISTAL sample statistics suggest a tentative anti-correlation with fDM(Re) and Σbary, although individual galaxy uncertainties are limited by the data depth. The horizontal dashed line denotes fDM for a maximal disk fDM ≔ 28% (van Albada et al. 1985). In the right panel, the two symbols plotted with only limit arrows represent CRISTAL-10a-E (upper limit) and CRISTAL-06b (lower limit). The stellar mass is only for CRISTAL-10a as a whole, which includes CRISTAL-10a-E, while no gas mass is available for CRISTAL-06b.
Current usage metrics show cumulative count of Article Views (full-text article views including HTML views, PDF and ePub downloads, according to the available data) and Abstracts Views on Vision4Press platform.
Data correspond to usage on the plateform after 2015. The current usage metrics is available 48-96 hours after online publication and is updated daily on week days.
Initial download of the metrics may take a while.