Fig. A.2.
Download original image
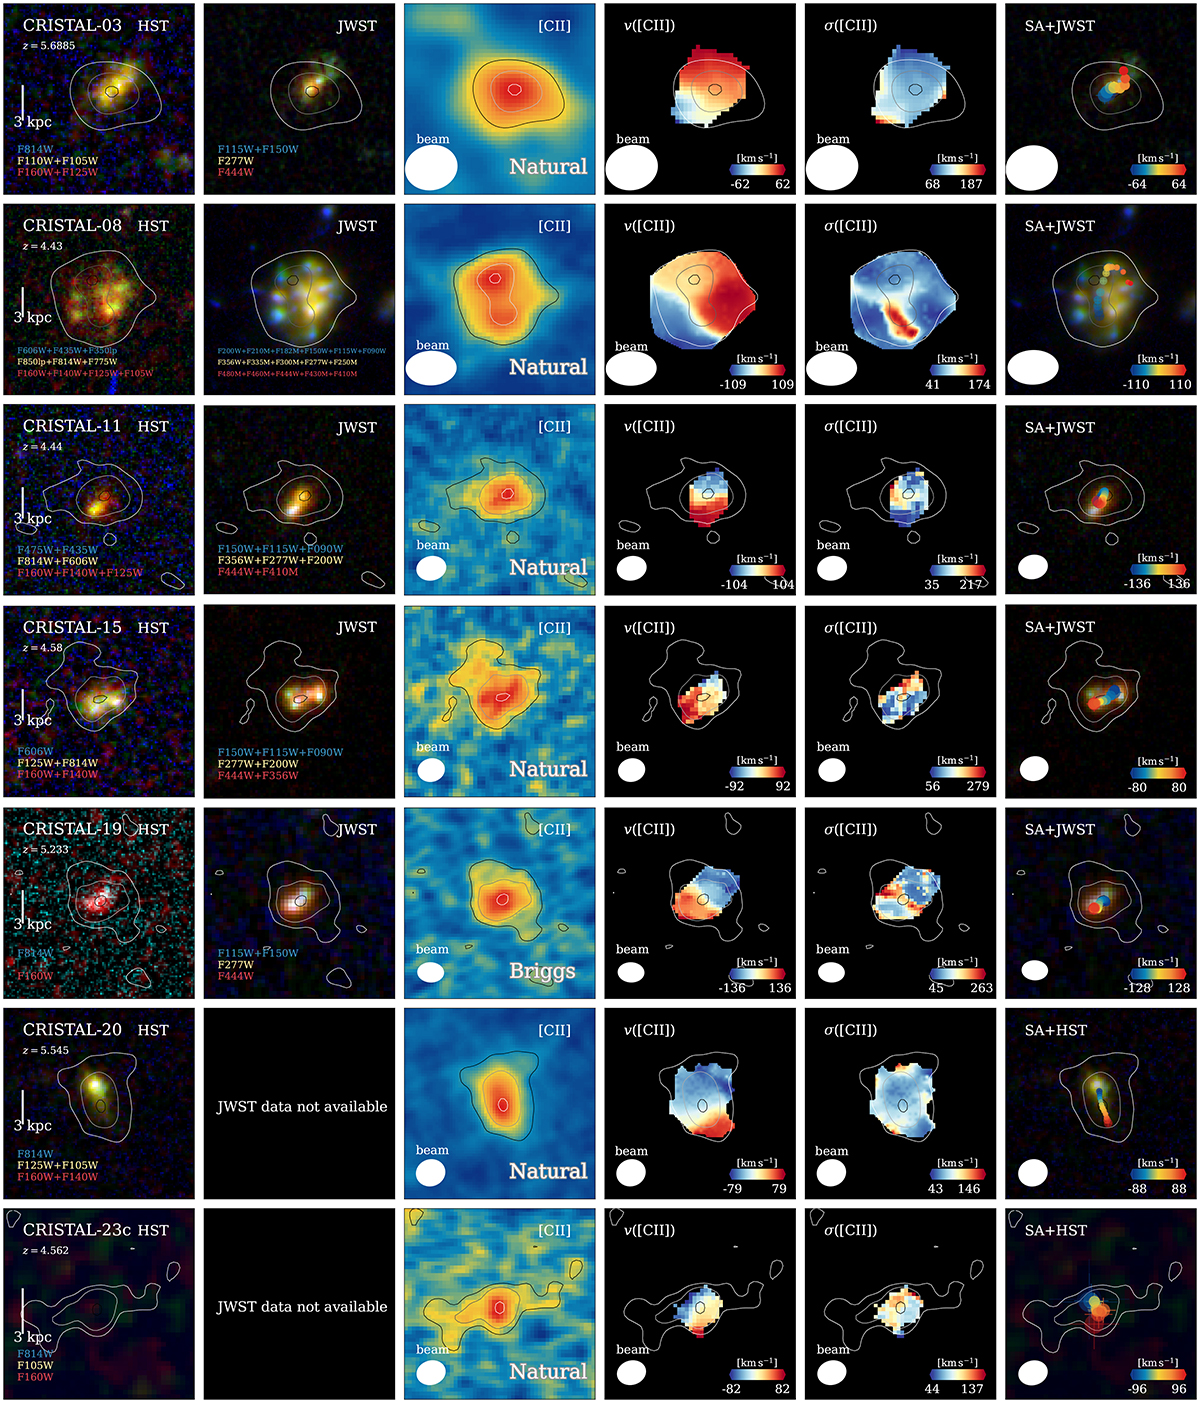
Gallery showing the multi-wavelength properties of the Best Disks. The first column displays the colour-composite images from HST, and if available, NIRCam/JWST images are shown in the second column. The third to fifth columns are ALMA images of [C II] emission, shown as line intensity, velocity, and velocity dispersion maps. The velocity and velocity dispersion maps are obtained by pixel-by-pixel single Gaussian fitting to the natural-weighted line cube, binned at ΔV = 20 km s−1 spectral resolution. They are not corrected for spectral broadening, beam-smearing and projection. The last column shows the spectro-astrometry (SA) measurement overlaid on HST (or NIRCam/JWST if available) colour images, in which the sizes and transparencies of the points are proportional to the positional uncertainties derived using Equation 1 in Condon et al. (1998). For all panels, the contours correspond to the intensities of the [C II] line map, plotted from 1.5σ to 3σ.
Current usage metrics show cumulative count of Article Views (full-text article views including HTML views, PDF and ePub downloads, according to the available data) and Abstracts Views on Vision4Press platform.
Data correspond to usage on the plateform after 2015. The current usage metrics is available 48-96 hours after online publication and is updated daily on week days.
Initial download of the metrics may take a while.