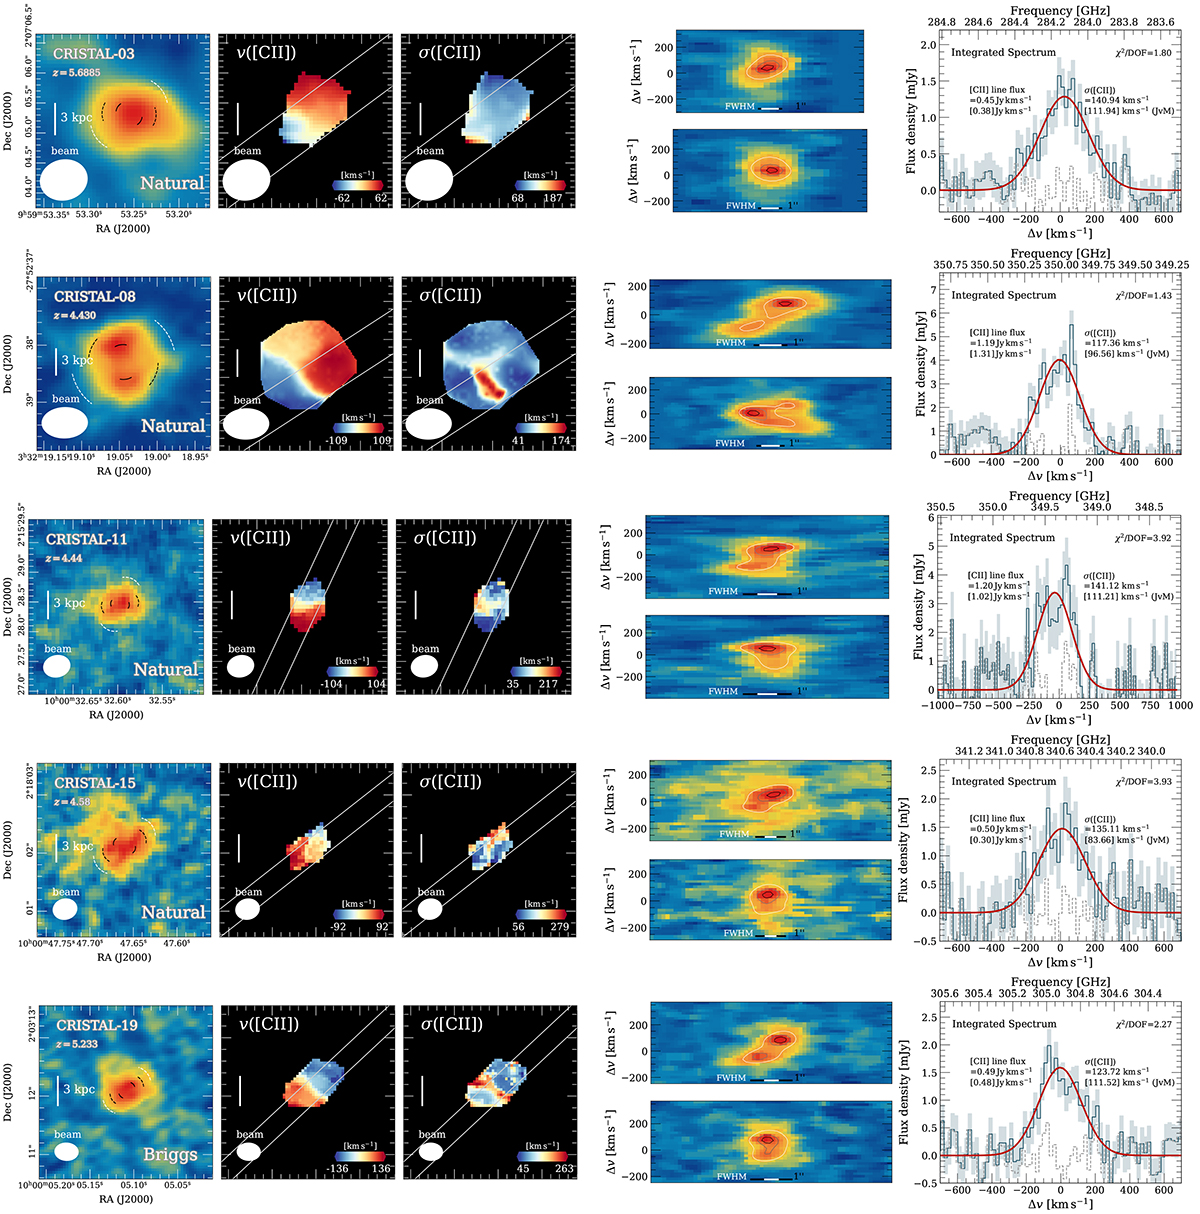
Fig. A.5.
Download original image
[C II] line maps, velocity maps, dispersion maps, position-velocity (p-v) diagrams (with median filtering applied for visual purposes), integrated spectra and shifted spectra of the Best Disk. In the [C II] line maps, the dashed pairs of arcs delineating the emission indicate the disk’s apparent morphological position angle (PAm, black) and the kinematic major axis (white). The solid pair of arcs represents the intrinsic PAm after correcting for the beam. In the p-v diagrams, the black and white horizontal bars correspond to 1″ and the synthesised beam FWHM, respectively.
Current usage metrics show cumulative count of Article Views (full-text article views including HTML views, PDF and ePub downloads, according to the available data) and Abstracts Views on Vision4Press platform.
Data correspond to usage on the plateform after 2015. The current usage metrics is available 48-96 hours after online publication and is updated daily on week days.
Initial download of the metrics may take a while.