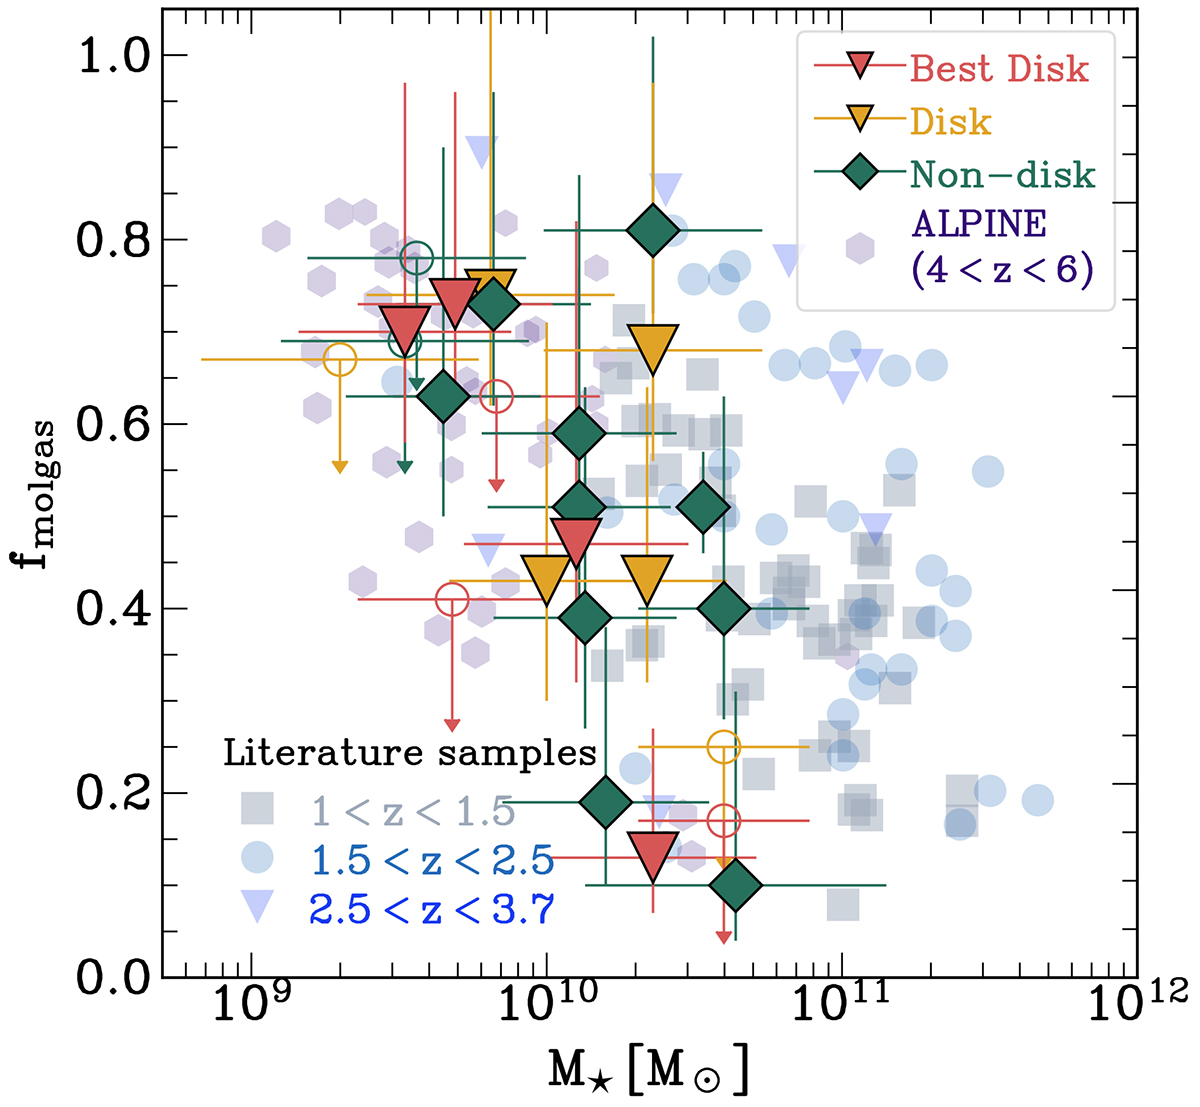
Fig. C.1.
Download original image
Molecular gas fraction, fmolgas, (Equation C.3) as a function of stellar mass as inferred from the Band-7 dust continuum based on Equation C.1. The points are colour-coded by their classifications described in Section 3. The empty circles represent upper limits. The median gas fraction of the CRISTAL sample is ∼ 0.5. Our measurements are in broad agreement with those reported by Dessauges-Zavadsky et al. (2020) for the ALPINE samples (purple hexagons), in which we both observe a similar slope of dependence of fmolgas on M⋆, similar to that of the lower redshifts 1≲ z ≲6 star-forming galaxies compiled by Dessauges-Zavadsky et al. (2020) and references therein (light grey to blue markers).
Current usage metrics show cumulative count of Article Views (full-text article views including HTML views, PDF and ePub downloads, according to the available data) and Abstracts Views on Vision4Press platform.
Data correspond to usage on the plateform after 2015. The current usage metrics is available 48-96 hours after online publication and is updated daily on week days.
Initial download of the metrics may take a while.