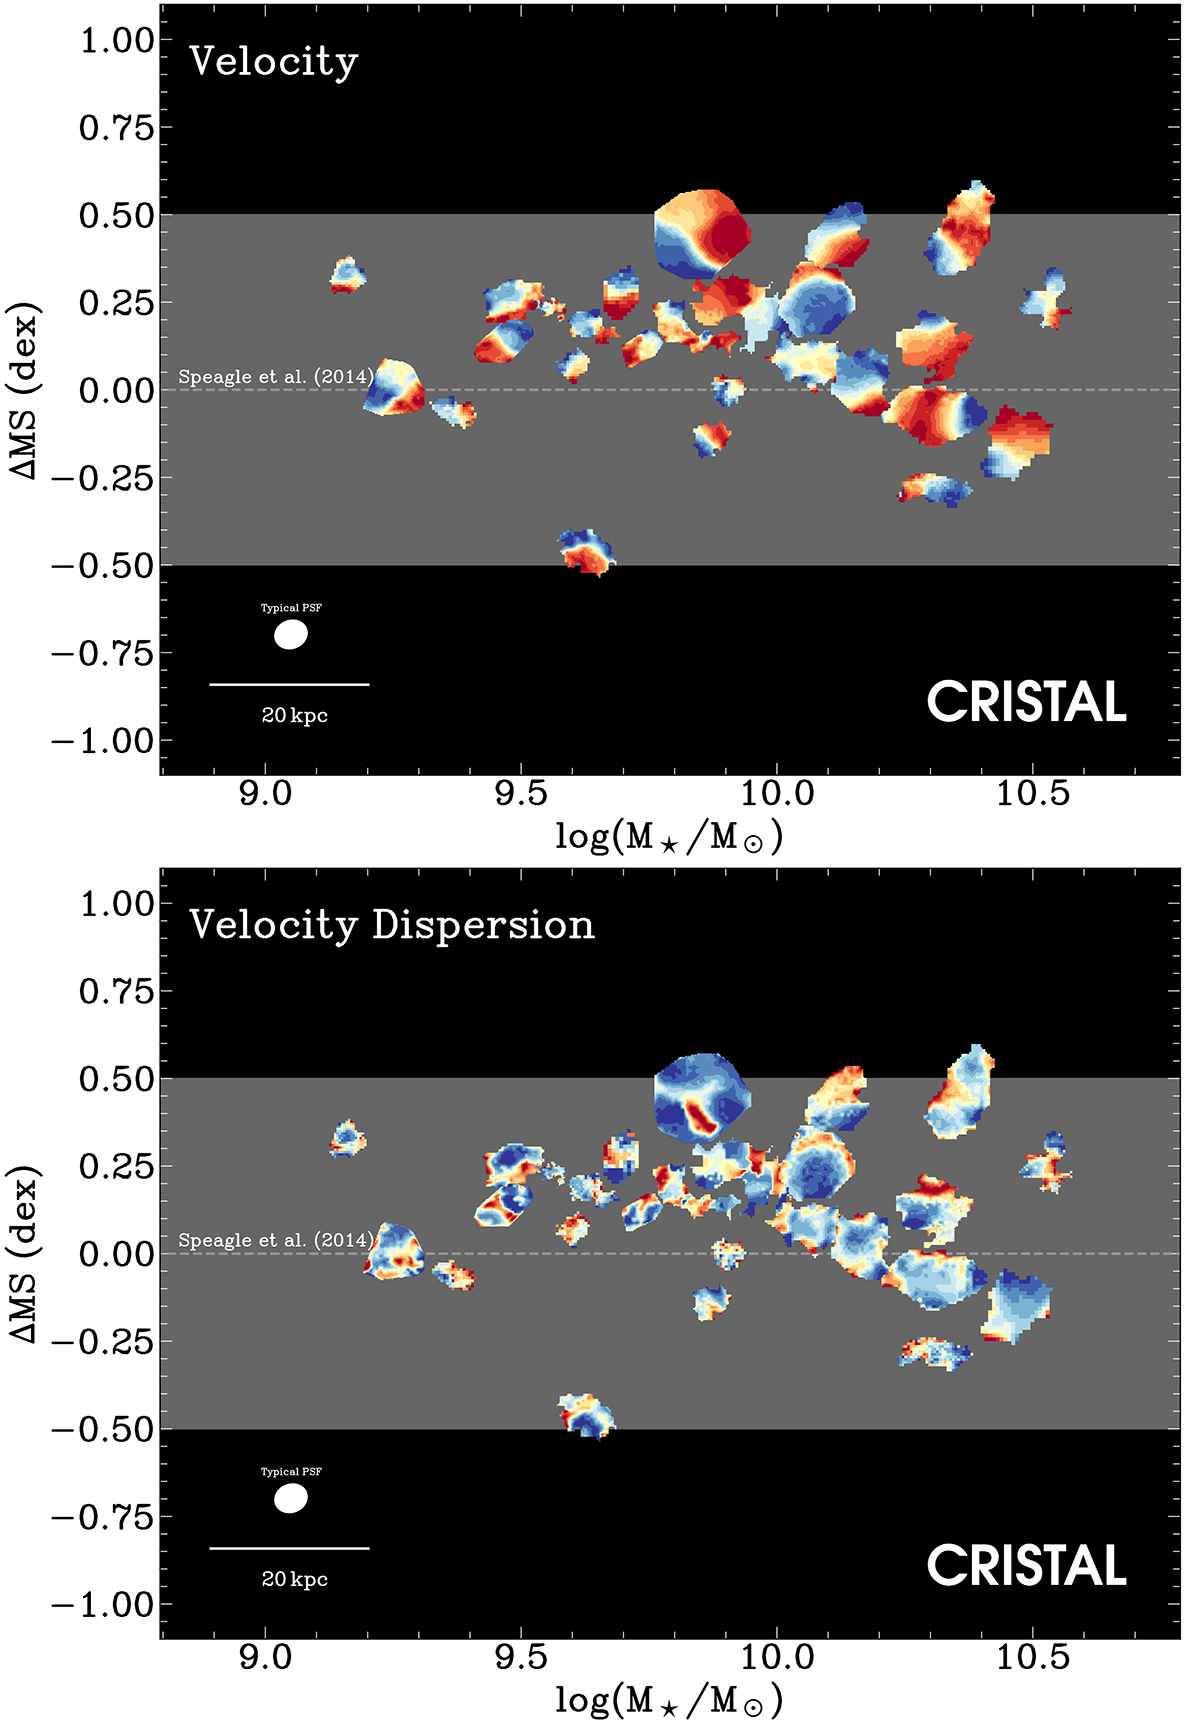
Fig. 3.
Download original image
Velocity (top) and velocity dispersion (bottom) fields of CRISTAL galaxies placed on the ΔMS offset relative to the Speagle et al. (2014) MS relation. The velocity and dispersion fields correspond to those derived from the [C II] emission described in Sect. 3.3. For the velocity fields, the colour coding represents the relative velocity of the line emission with respect to the systemic velocity. For the dispersion fields, the colour coding indicates the widths (in standard deviation) of the 1D Gaussian fitted to the spectra of individual spaxels. All sources are shown in the same field of view of 3″ (∼20 kpc at z ∼ 5). The median beam size (0![]() 43 × 0
43 × 0![]() 36) with position angle (104° counter-clockwise from north) is shown at the bottom left. The individual values are listed in Table 1.
36) with position angle (104° counter-clockwise from north) is shown at the bottom left. The individual values are listed in Table 1.
Current usage metrics show cumulative count of Article Views (full-text article views including HTML views, PDF and ePub downloads, according to the available data) and Abstracts Views on Vision4Press platform.
Data correspond to usage on the plateform after 2015. The current usage metrics is available 48-96 hours after online publication and is updated daily on week days.
Initial download of the metrics may take a while.