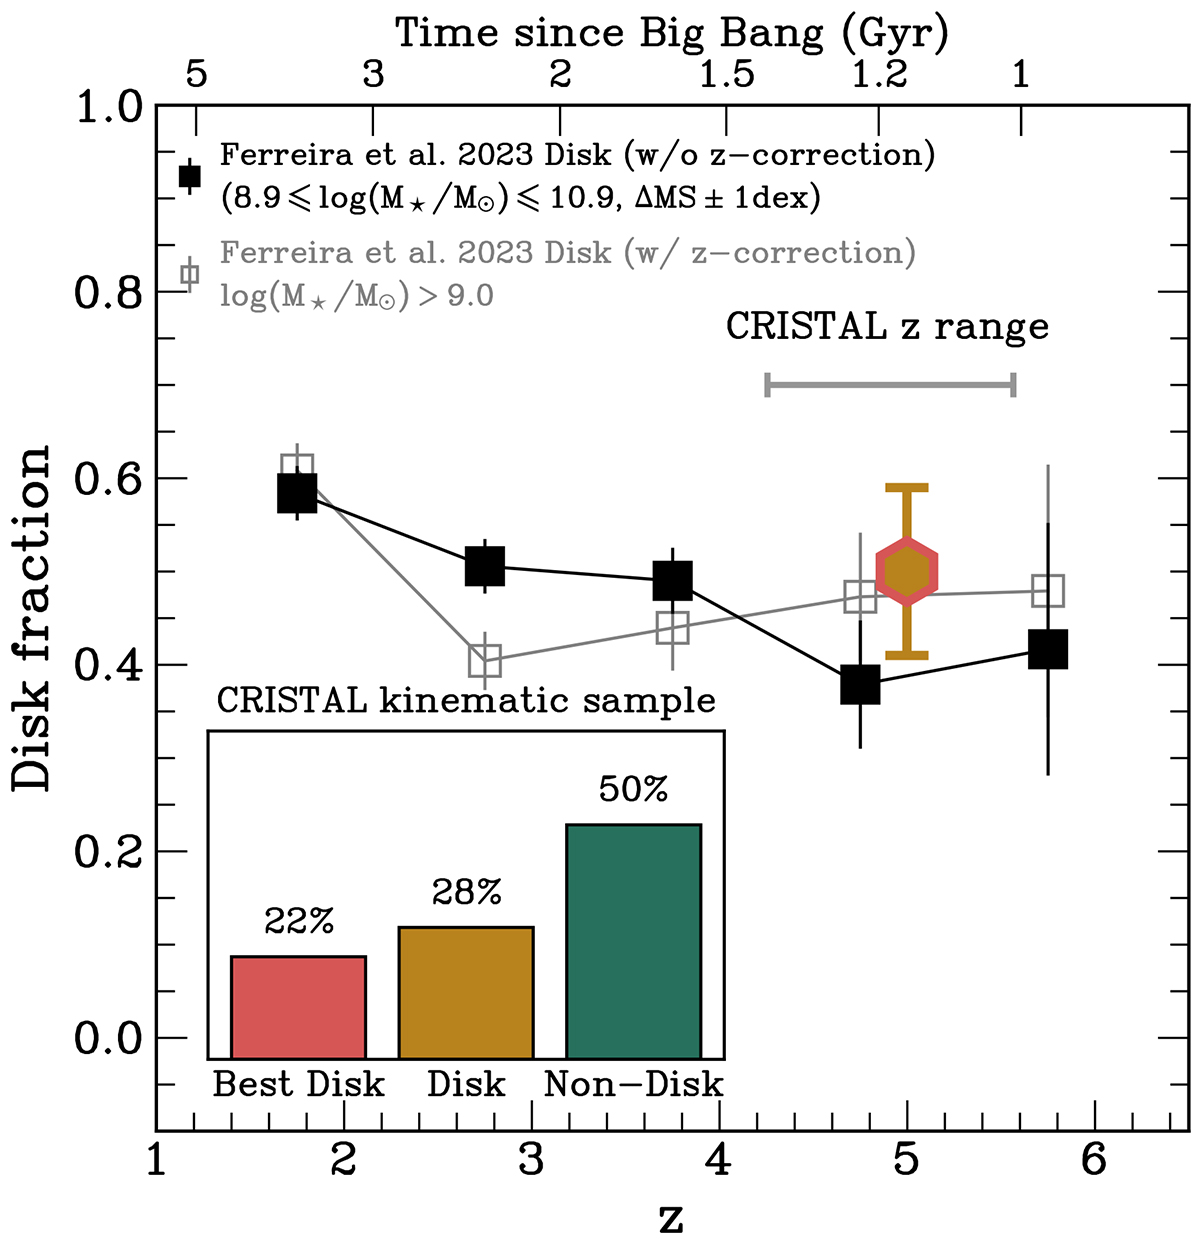
Fig. 5.
Download original image
Comparison of the CRISTAL total disk fraction (yellow hexagon with red outline) to the mass-selected sample from Ferreira et al. (2023) based on CRISTAL mass range. The grey curve with square markers shows the ‘redshift-corrected’ trend of their high-mass bin. To more fairly compare with our sample, we further selected so that their star formation rates are within 1 dex from the Speagle et al. (2014) MS relation. The grey horizontal line indicates the redshift range of CRISTAL (4.4 < z < 5.7). The black solid curve with square markers represents the redshift evolution of disk fraction as reported by Ferreira et al. (2023) before their application of ‘redshift corrections’, which primarily account for surface-brightness effects in higher redshift objects. It would be a more equal comparison since we do not apply any such correction to the CRISTAL disk fraction. The inset shows the distribution of Best Disk, Disk, and Non-disk among the CRISTAL sample.
Current usage metrics show cumulative count of Article Views (full-text article views including HTML views, PDF and ePub downloads, according to the available data) and Abstracts Views on Vision4Press platform.
Data correspond to usage on the plateform after 2015. The current usage metrics is available 48-96 hours after online publication and is updated daily on week days.
Initial download of the metrics may take a while.