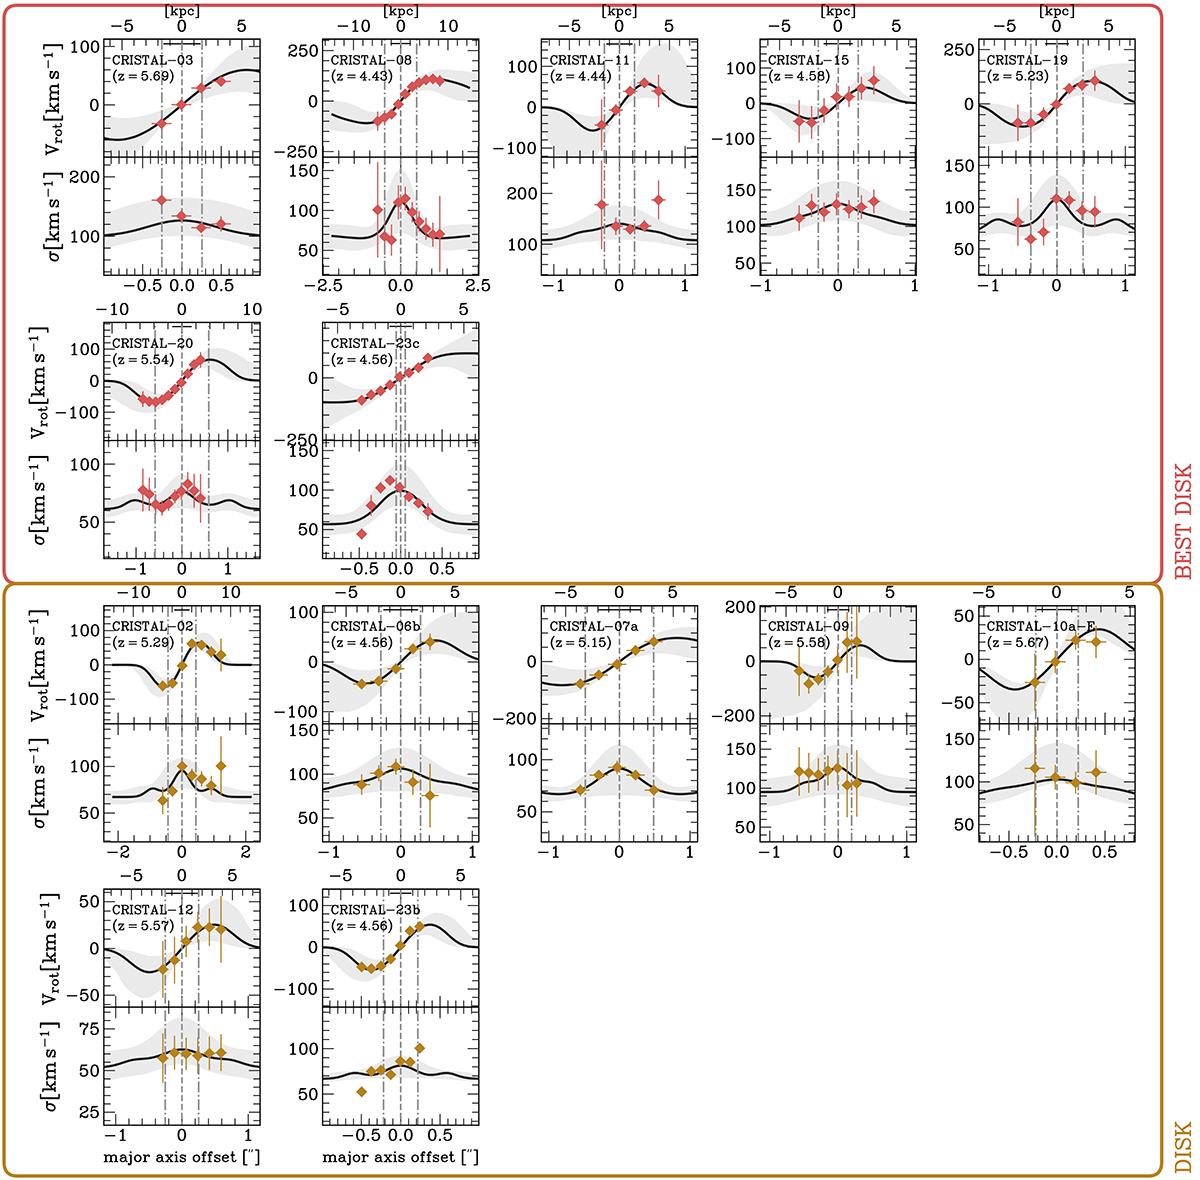
Fig. 6.
Download original image
Observed rotation curves (RCs) of the CRISTAL disk sample. The RCs are the fitted line velocity centroids of the position-velocity diagram extracted along the kinematic major axis. The RCs are grouped according to their kinematics types. The black curves are the extracted 1D model (in the same way as data) from the best-fit 3D model cube from DysmalPy. The 3D model cubes are projected and convolved with the beam, which gives rise to the apparent central peak in the velocity dispersion profile and the shallower velocity profiles. The two symmetric grey vertical lines about the dynamical centre indicate the effective radius. The synthesised beam size is shown as the horizontal black line at the top. CRISTAL-05 and 22a belong to Disk, their velocity profiles are shown in Posses et al. (2025) and Telikova et al. (2025), respectively.
Current usage metrics show cumulative count of Article Views (full-text article views including HTML views, PDF and ePub downloads, according to the available data) and Abstracts Views on Vision4Press platform.
Data correspond to usage on the plateform after 2015. The current usage metrics is available 48-96 hours after online publication and is updated daily on week days.
Initial download of the metrics may take a while.