Fig. 12
Download original image
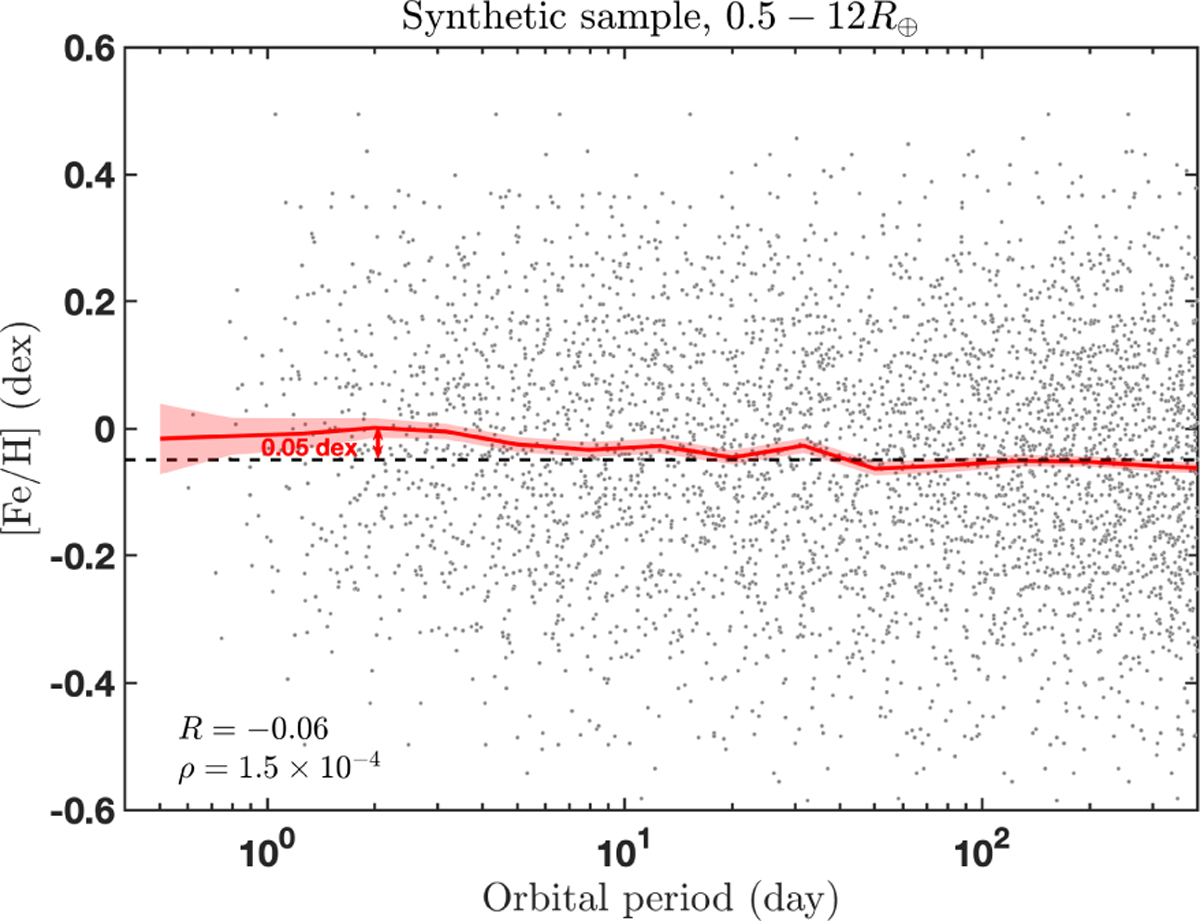
Host star metallicities vs. planet orbital period (grey dots) from the synthetic sample. The red line denotes the kernel regression of the mean metallicity of the planet population (from Equation (16)). The shaded red area shows the 68% (1-σ) confidence interval on the mean from bootstrapping. The dashed black line represents the mean metallicity (−0.05 ± 0.04 dex) for stars that host planets with a period >ten days. In the bottom-left corner, we print the Pearson coefficient R between host star metallicity and the orbital periods as well as the correspond p–value.
Current usage metrics show cumulative count of Article Views (full-text article views including HTML views, PDF and ePub downloads, according to the available data) and Abstracts Views on Vision4Press platform.
Data correspond to usage on the plateform after 2015. The current usage metrics is available 48-96 hours after online publication and is updated daily on week days.
Initial download of the metrics may take a while.