Fig. 2
Download original image
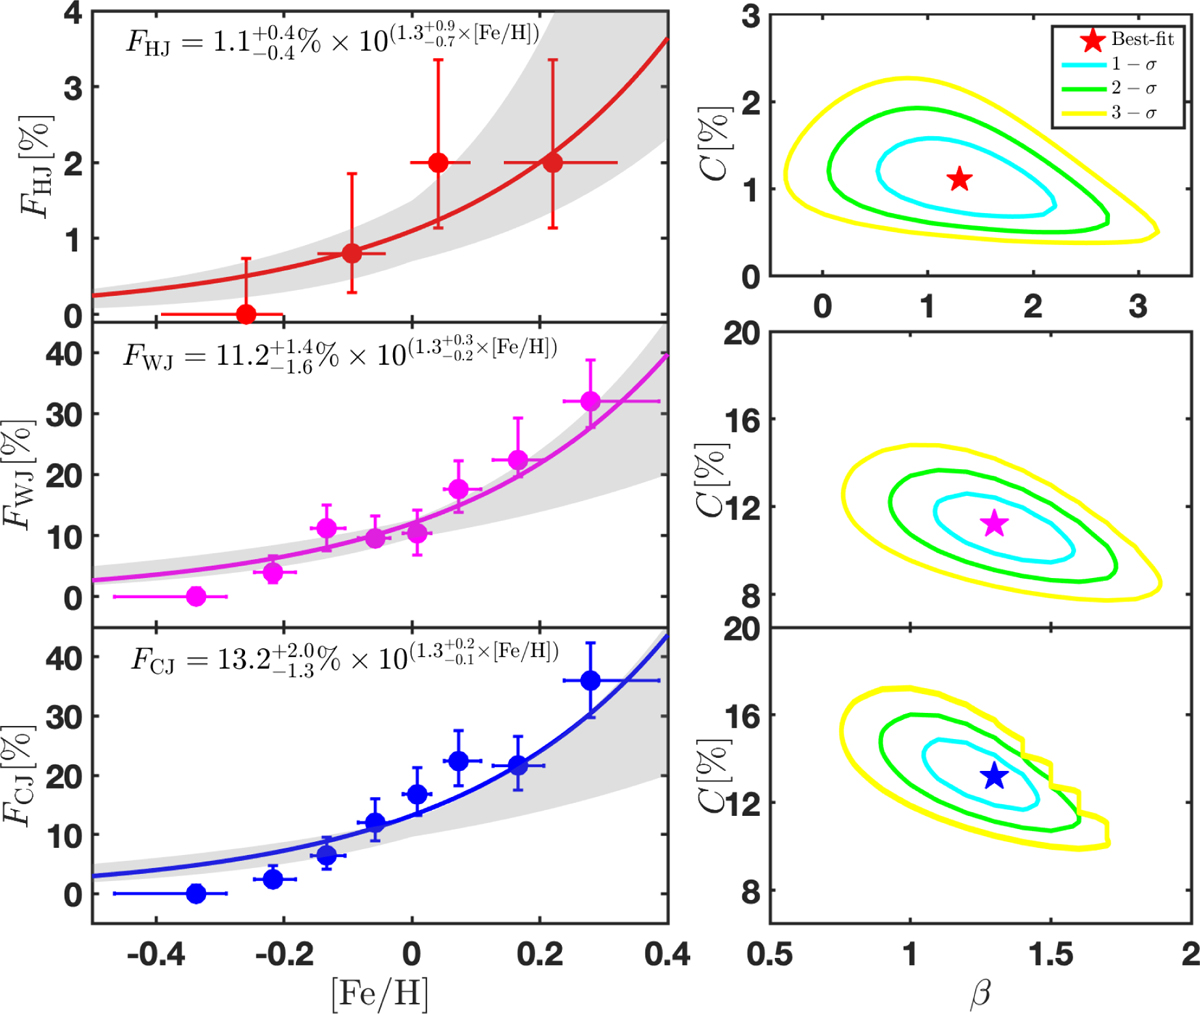
Left panels: the occurrence rate of hot Jupiters (top), warm Jupiters (middle), and cold Jupiters (bottom) as a function of stellar metallicity [Fe/H] from the synthetic NGPPS population and evolution model at 5 Gyr. The solid lines denote the best fits of Equation (1). For the occurrence rate, we were more concerned with the increasing trend rather than the absolute magnitude. Thus, to compare the synthetic results with observations, we used the fitted β derived from the observational sample in Chen et al. (2023) and the C derived from the synthetic sample to generate the 1 − σ intervals for the observational results, which are plotted as grey regions. Right panels: marginalized posterior probability density distributions of the parameters (C,β) for the occurrence rates of hot Jupiters (top), warm Jupiters (middle), and cold Jupiters (bottom) conditioned on the synthetic data generated by the Bern model.
Current usage metrics show cumulative count of Article Views (full-text article views including HTML views, PDF and ePub downloads, according to the available data) and Abstracts Views on Vision4Press platform.
Data correspond to usage on the plateform after 2015. The current usage metrics is available 48-96 hours after online publication and is updated daily on week days.
Initial download of the metrics may take a while.