Fig. 7
Download original image
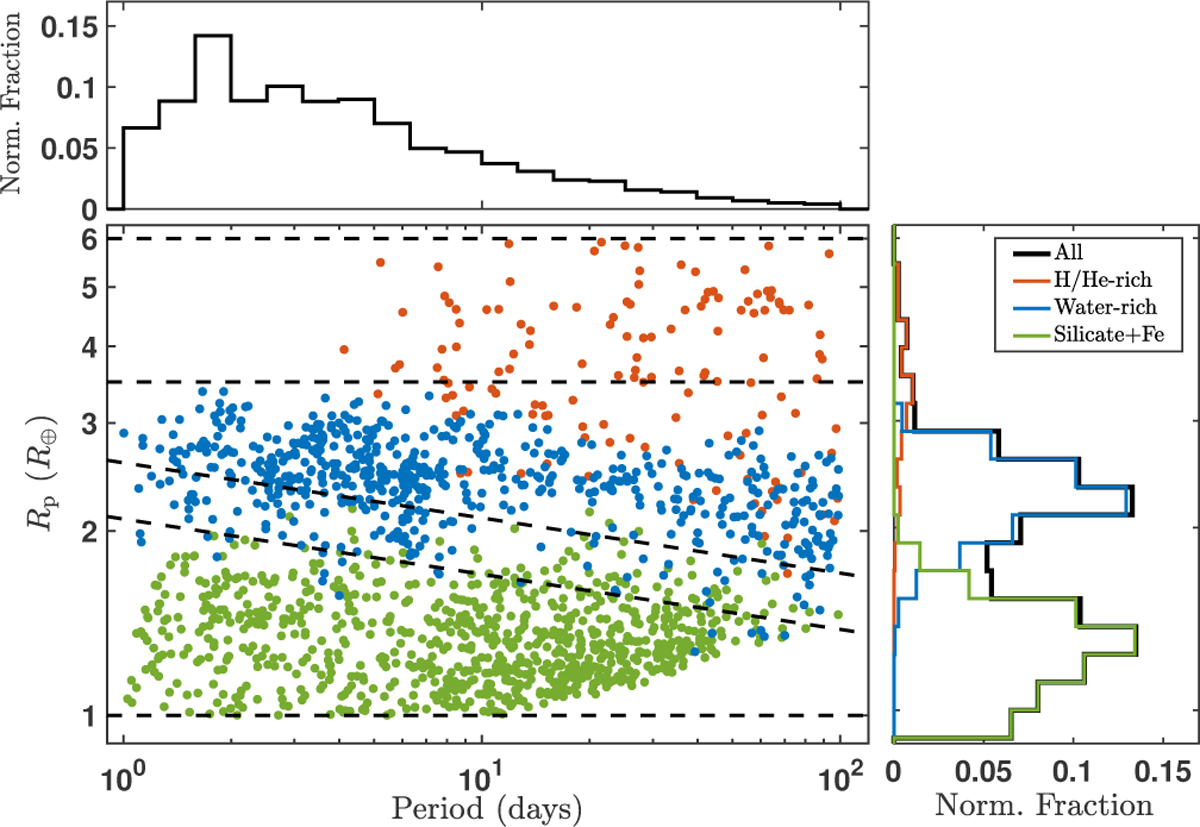
Period–radius diagram of planets selected from the synthetic population at 2 Gyr after applying the detection selection similar to PAST III (Chen et al. 2022). Planets with different compositions are plotted in different colours: red for H/He-rich envelopes, blue for waterrich envelopes, and green for purely rocky (Silicate+Fe) planets. The dashed lines represent the boundaries of planet radii between different subsamples: Neptune-sized planets, sub-Neptune, valley planet, and super-Earth. Histograms of planetary radius and orbital period are shown in the right panel and the top panel, respectively.
Current usage metrics show cumulative count of Article Views (full-text article views including HTML views, PDF and ePub downloads, according to the available data) and Abstracts Views on Vision4Press platform.
Data correspond to usage on the plateform after 2015. The current usage metrics is available 48-96 hours after online publication and is updated daily on week days.
Initial download of the metrics may take a while.