Fig. A.1.
Download original image
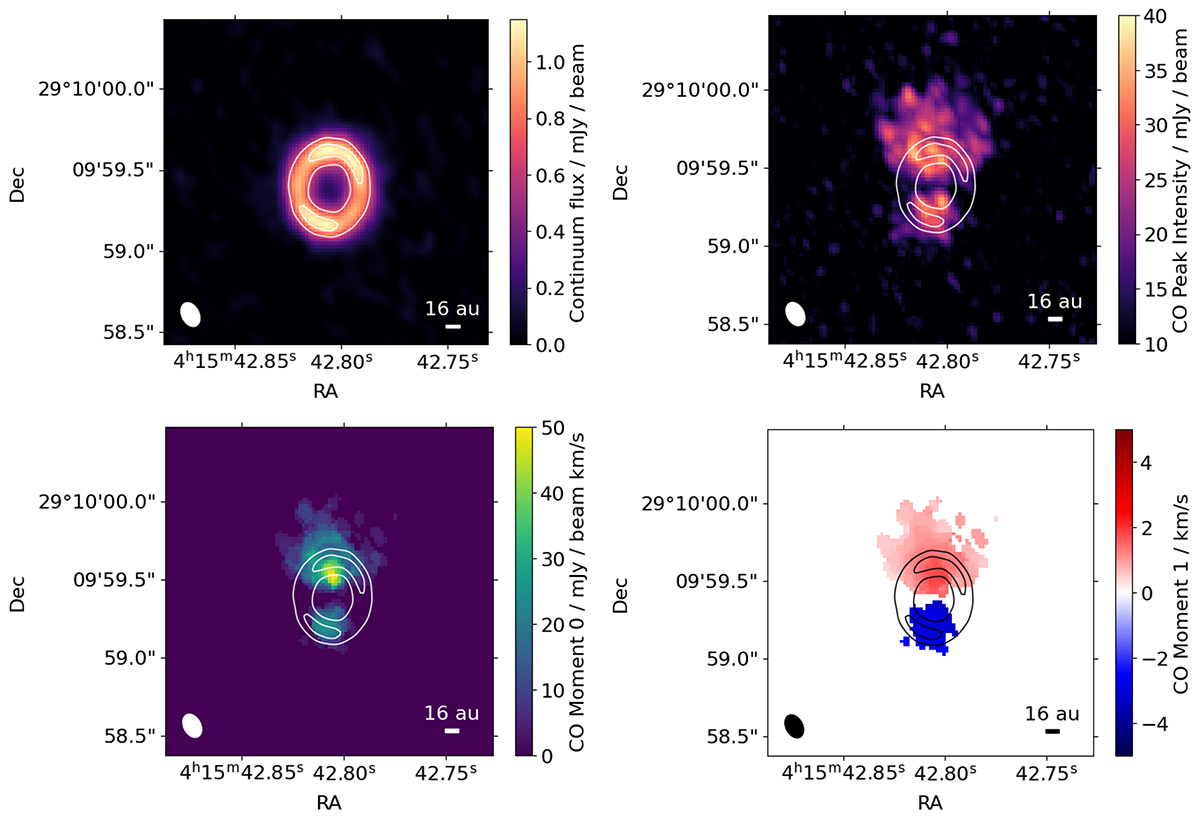
ALMA Band 6 observations of the circumstellar disk around the primary. The contour lines show the 10σ and 15σ continuum emission. The top left panel shows the 1.3 mm continuum emission map, the top right panel the CO peak intensity map, the bottom left panel the CO moment 0 map, and the bottom right panel the CO moment 1 map.
Current usage metrics show cumulative count of Article Views (full-text article views including HTML views, PDF and ePub downloads, according to the available data) and Abstracts Views on Vision4Press platform.
Data correspond to usage on the plateform after 2015. The current usage metrics is available 48-96 hours after online publication and is updated daily on week days.
Initial download of the metrics may take a while.