| Issue |
A&A
Volume 701, September 2025
|
|
|---|---|---|
| Article Number | L15 | |
| Number of page(s) | 9 | |
| Section | Letters to the Editor | |
| DOI | https://doi.org/10.1051/0004-6361/202555391 | |
| Published online | 26 September 2025 | |
Letter to the Editor
Late accretion offers pathway to misaligned disk around the planet-hosting IRAS 04125+2902
1
Institut für Theoretische Astrophysik, Zentrum für Astronomie der Universität Heidelberg, Albert-Ueberle-Str. 2, 69120 Heidelberg, Germany
2
Max-Planck Institute for Astronomy (MPIA), Königstuhl 17, 69117 Heidelberg, Germany
⋆ Corresponding author: This email address is being protected from spambots. You need JavaScript enabled to view it.
Received:
5
May
2025
Accepted:
8
September
2025
Abstract
We present a 3D hydrodynamical simulation of the accretion of a gas cloudlet onto the IRAS 04125+2902 binary system, where the 3-Myr-old primary hosts a transiting planet. We demonstrate that such an accretion event can naturally produce a circumstellar disk that is misaligned with respect to the rest of the system, consistent with the observed misaligned transition disk. In the model, the prescribed orbital plane of the cloudlet is largely retained by the resulting circumstellar disk after undergoing gravitational interactions with the secondary during the initial accretion. After ∼4.4 binary orbits, a disk with Rd = 300 AU has formed around the stellar primary made of ∼13% of the cloudlet mass, Md,p = 2.1 × 10⁻³ M⊙. The companion also retains some of the cloudlet’s mass and forms a disk with Md,c = 9.3 × 10⁻⁵ M⊙, though only the transition disk around the primary has been observed. Our findings highlight the importance of considering mass inflow onto a protoplanetary disk for its evolution.
Key words: accretion, accretion disks / hydrodynamics / methods: numerical / protoplanetary disks / binaries: general / ISM: clouds
© The Authors 2025
 Open Access article, published by EDP Sciences, under the terms of the Creative Commons Attribution License (https://creativecommons.org/licenses/by/4.0), which permits unrestricted use, distribution, and reproduction in any medium, provided the original work is properly cited.
This article is published in open access under the Subscribe to Open model. This email address is being protected from spambots. You need JavaScript enabled to view it. to support open access publication.
1. Introduction
In the current picture of exoplanet formation, planets are the products of multiscale processes whereby initially micron-sized dust grains grow into planetary embryos that migrate and accrete (for a review, see Drążkowska et al. 2023). These processes occur in the protoplanetary disk around a young star and, as a result, fully formed planets are generally expected to lie in the same orbital plane as the disk out of which it formed.
Recent observations of the IRAS 04125+2902 binary system, located inside the Taurus star-forming region, reveal a 0.3 MJ transiting giant planet (Barber et al. 2024) around the stellar primary, with a semimajor axis of 0.077 AU. This discovery paints a peculiar picture of the system configuration. While it appears that the orbital axis of the giant planet is consistent with the orbital axis of the ∼4″ companion, the transition disk observed in this system is misaligned relative to both. The stellar inclination is i⋆ > 78°, consistent with the planetary orbit, and the inclination of the binary orbit is  degrees with respect to the plane of the sky. In contrast to the nearly edge-on configuration of all the system components, the inclination of the transition disk is more face-on, with id = 31 ± 12°, first estimated based on low-resolution continuum data (Espaillat et al. 2015) from the Submillimeter Array (SMA), and then confirmed by CO emission and high-resolution continuum from the Atacama Large Millimeter/submillimeter Array (ALMA; see our Appendix A and Bosschaart et al. 2025; Shoshi et al. 2025).
A transition disk that is highly misaligned with the other system components, especially with respect to the giant planet’s orbit, is unexpected. Planets embedded in a protoplanetary disk are subject to eccentricity and inclination damping due to planet–disk interactions (Tanaka & Ward 2004; Marzari & Nelson 2009; Bitsch & Kley 2011), suggesting the misalignment would have to arise by gravitational interaction after the natal inner disk has dissipated. Alternatively, as the alignment of the stellar spin and binary orbit suggests, the entire disk could have been initially aligned with the planet’s current orbit, but become misaligned later. The interaction with the known companion would preferentially align the disk to the binary orbit (Christian et al. 2022). However, while the inclination of the planet and binary orbit are consistent, we note that the planet’s position angle is not constrained. In general, a disk-planet misalignment could, for example, be caused by an outer companion (Papaloizou et al. 1995; Zanazzi & Lai 2018), but the secondary star and giant planet are the only detected massive objects in IRAS 04125+2902. A stellar flyby could also cause disk misalignment (Clarke & Pringle 1993; Nealon et al. 2020). For the system at hand, it has been suggested that the system was initially an unstable triplet, and that the ejection of the third star induced the misalignment (Nealon et al. 2025). However, such a scenario implies further misalignment of the other system components and offers an unlikely explanation if the binary and planetary orbits are truly aligned.
We present an alternative explanation for the misalignment. Using 3D hydrodynamical simulations, we show that the observed transition disk could be a second-generation disk accreted during an encounter with a gas cloudlet. Previous work has demonstrated that an encounter with a cloudlet can lead to the formation of a second generation disk around single stars (Dullemond et al. 2019; Kuffmeier et al. 2020), and late infall events have been proposed to explain streamer structures onto protoplanetary disks (e.g., Ginski et al. 2021; Hanawa et al. 2024; Calcino et al. 2025; Speedie et al. 2025). In our simulation, a misaligned disk arises naturally in a similar fashion from the accretion of the gas cloudlet, and an initial misalignment between the secondary and the cloudlet orbit can survive despite the gravitational influence of the companion and mass transfer events. This suggests that the observed transition disk need not be the same disk that formed the giant planet, and no additional massive object is required to explain its misalignment.
2. Methods
We performed 3D hydrodynamical simulations using the FARGO3D code (Benítez-Llambay & Masset 2016), a grid-based code that utilizes the FARGO orbital advection algorithm (Masset 2000). We used a spherical grid centered on the primary star that is spaced logarithmically in the radial dimension, extending from θmin = 20° to θmax = 160°, and from rmin = 10 AU to rmax = 5000 AU. We chose the number of grid cells to be Nr = 280, Nθ = 110, and Nϕ = 280. The resulting resolution is Δϕ = Δθ = 1.3° and Δr/r = 0.022 ≃ Δϕ, corresponding to two cells per pressure scale height (cps) at 10 AU (three at 50 AU). The system was integrated up to a physical time of tend = 94.8 kyr, corresponding to 4.4 binary orbits. The polar and radial boundaries were both modeled as open so that mass can leave the simulation domain, but cannot enter.
The simulations assume a locally isothermal equation of state, P = ρcs2, where P is the gas pressure, ρ is the density, and cs is the radius-dependent isothermal sound speed. For the initial condition, there is no disk around either star. The respective temperature is determined solely by passive irradiation of the central star with a floor value Tfloor, so that the aspect ratio h = H/r of the eventually accreted disk is given by h = h0(r/r0)β, with H being the gas pressure scale height, the radial distance r, constants r0 and h0 and the flaring index β. We used Tfloor = 10 K, so that cs,floor = 0.19 km s−1, reached at rfloor = 796 AU. We adopted h0 = 0.038, r0 = 5.2 AU, and β = 0.25. A kinematic viscosity ν was included, given as a constant α parameter (Shakura & Sunyaev 1973) of α = 10−3, so that ν = αcs2/Ω. The kinematic viscosity was included in every cell in the simulation grid, and calculated with respect to the primary even if the material is not bound to it, so that  with M⋆ = 0.7 M⊙ (Barber et al. 2024). As a result, the viscosity of the cloudlet is negligible. We introduced a numerical background density of ρbg = 10−21g cm−3, comparable with the typical density in Taurus (Pineda et al. 2010). We neglected the small gravitational influence of the giant planet in our model.
It may seem natural to put the origin of the coordinate system on the barycenter. However, for simplicity in the implementation of the boundary conditions, and for numerical reasons such as numerical diffusion due to the movement of the inner disk edge in a barycentric system, the FARGO3D code centers the coordinate system on the central star. The inertial force caused by the acceleration of the star by the companion, and therefore the acceleration of the entire coordinate system, is accounted for in the gas potential. This is commonly referred to as the indirect term (Crida et al. 2025); however, the gravitational forces and corresponding frame acceleration by the gas onto the two stars is not included.
2.1. Binary companion
For the binary orbit, we employed the semimajor axis determined by orbital fitting, a = 4.66″ (Barber et al. 2024, Extended Data Fig. 5), resulting in a ≈ 742 AU, and a mass of Ms = 0.17 M⊙. As the orbital eccentricity of the companion is unconstrained, we chose e = 0 for simplicity. We chose a coordinate system such that the companion has an inclination of ic = 60°, whereas the cloudlet orbit is not inclined, that is, it lies in the x − y plane. The companion was initialized at the apoastron. To model the orbital motion, we use the fifth-order Runge-Kutta N-body solver included in FARGO3D.
2.2. Cloudlet initial condition
The gas cloudlet was initially modeled as a sphere with radius Rc = 1500 AU. The center of the sphere was placed on a hyperbolic orbit with impact parameter regarding the center of mass of b = 0.52G(M⋆ + Ms)/v∞2 = 1615 AU, with a speed at infinity of v∞ = 0.5 km s−1 and at a distance of rini = 3000 AU, resulting in a lapse time to the periapsis of 13.4 kyr. This implies an eccentricity of e = 1.43 and a periapsis distance of rp = 393 AU. The initial velocity was assumed to be constant across the extent of the cloudlet and given by the orbital velocity. The total mass of the cloudlet is Mc = 0.016 M⊙ with an initially uniform density of ρc = 6.72 × 10⁻¹⁹ g cm−3, a value comparable to the density of a filamentary structure in Taurus (Palmeirim et al. 2013).
3. Results
We find that the gas cloudlet is accreted and forms circumstellar disks around both the primary and the secondary1. As the cloudlet and binary system undergo gravitational interactions, the orbital misalignment evolves over time from the initial value of ϑd, o = 60°. Due to the steady infall of material with different angular momentum, caused by the fallback of gas surrounding the system after the initial encounter, the disk also becomes warped. However, after ∼4.4 binary orbits, we find that the misalignment between the disk and the binary orbit is still significant, that is, the gravitational interactions with the binary did not force it on an aligned orbit to a significant extent.
The final system configuration is shown in Fig. 1, depicting the column density of the gas in the true line of sight to the source, matching the known position angle of the binary orbit, PA ≈ 198° (Barber et al. 2024). Qualitatively, we find that the overall shape of the primary disk matches that of recent ALMA observations, presented in Appendix A, though the simulated disk is larger than observed. The misalignment with the binary orbit is apparent as the view is edge-on to the binary orbit. While Fig. 1 shows that there is still material left over from the accretion event, the system is dynamically quiescent at this stage, and the gas remnants are expected to diffuse away or get accreted on longer timescales. We show more simulation snapshots in Appendix C.
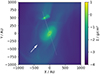 |
Fig. 1. Gas column density at tend = 94.8 kyr. The camera angle is such that the position angle of the binary orbit corresponds to the observed value. The orbit is indicated by the white dotted line, and the white arrows indicate the initial infall direction. |
Figure 2 shows the final orientation of the disk around the primary, that is, the angle between the mass-weighted average angular momentum vector of a spherical shell at a given radius and the angular momentum vector of the binary orbit. For reference, it also shows the cumulative mass of the primary disk as a function of radius and a rough estimate for the disk extent, Rdisk ≈ 300 AU. More information on the disk masses is provided in Appendix B. We find a misalignment varying between ∼47° and ∼60° due to the warp (see above). The overall disk misalignment, that is, the mass-weighted average of all spherical shell orientations, is  . This value is consistent with the observed inclination within 1σ, under the assumption that the position angle of the transition disk is close to zero, which is subject to observational uncertainty. We note that on long timescales the misalignment could increase or decrease due to von Zeipel-Kozai-Lidov oscillations, which the disk is susceptible to due to its large extent (Zanazzi & Lai 2017; Nealon et al. 2025).
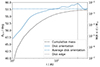 |
Fig. 2. Orientation of the primary disk. The angle between the angular momentum vector of a ring at the radius indicated on the horizontal axis and the binary orbit is shown as a solid blue line. The mass-weighted average value is given by the dashed blue line. For reference, the disk’s cumulative mass is indicated by the dashed black line, whereas the dotted vertical black line denotes the limiting radius for the mass-weighting. |
Our proposed scenario of the accretion of a second-generation disk serving as the explanation for the disk-planet misalignment, possibly after undergoing further evolution toward a transition disk after the end of the simulation, is presented in greater detail in Appendix D. It has two defining features that set it apart from flyby-based scenarios. First, the accretion event naturally leads to the formation of disks around both stars, not only around the primary. Second, the accretion event does not perturb any other elements of the overall system. In other words, while explanation based on gravitational interaction have difficulties explaining the misalignment of the disk if all other elements are truly aligned with each other, this is the natural and expected outcome of a late accretion event.
4. Discussion
4.1. Model considerations
As a proof-of-concept approach, we realized one particular accretion event in the simple form of a spherical cloudlet with a given impact parameter. We expect a higher impact parameter to lead to a more extended disk, and a smaller value to a smaller disk but also smaller misalignment due to the specific angular momentum of the cloudlet gas. However, the complexity of a more detailed study of late infall in the interstellar medium (ISM) or a parameter study is beyond the scope of this letter, and we did not aim to reproduce all facets of the IRAS 04125+2902 system. Additionally, interaction with the cloudlet gas may affect the giant planet’s orbit, because the accreted primary disk mass is higher than the planet mass, Md, primary = 2.2 MJ. However, we did not consider the implications of this interaction, which has a significant impact in a flyby scenario (Nealon et al. 2025) as it is outside the scope of this letter.
Nevertheless, we considered the impact of the grid resolution on our results. We chose to initialize the simulation such that the cloudlet orbit is in the midplane of the spherical grid, and the companion’s orbit such that the initial misalignment between the two orbits is 60°. Grid-related forcing effects, though they are reduced in a spherical grid, promote the retention of the cloudlet in the midplane (e.g., Hopkins 2015). As a result, our setup promotes the misalignment we find for numerical reasons. We therefore ran an identical simulation with a modified grid resolution of Nr = 140, Nθ = 440, and Nϕ = 140. This corresponds to 8 cps in colatitude at 10 AU, which can alleviate this effect (Kimmig & Dullemond 2024), at the cost of a loss of resolution by a factor of 2 in the other dimensions. We find  , which remains consistent with the observation within 1σ. This test confirms that the found misalignment is not due to numerical effects. However, the disk is considerably less warped, indicating that the employed resolution is not sufficient to make quantitative statements. The details are discussed in Appendix E.
4.2. Comparison with observation
The primary goal of this study is to show a possible pathway to the observed orbital misalignment of the transition disk around IRAS 04125+2902. While such a misalignment is indeed a natural outcome of late accretion as shown in our simulation, other observables of the system cannot be addressed with this setup.
The disk observed around the primary is a transition disk. The continuum dust emission shows an inner cavity extending to ∼20 AU, and the outer disk to ∼40 AU. The gas disk appears more extended, with CO emission reaching out to ∼120 AU (see Appendix A). In contrast, our simulation, which does not include dust, shows a gas disk out to ∼300 AU. There is no inner cavity, though the inner edge of the simulation grid is located at 5 AU. Even though we neglect the giant planet, it is unlikely to be the cause, due to its low mass and semimajor axis. Even at higher mass and larger semimajor axis, the planet would either be too inclined to carve a gap (Xiang-Gruess & Papaloizou 2013) or would be subject to inclination damping inconsistent with the observations (Bitsch & Kley 2011). Therefore, another mechanism must be responsible for its formation. While we find a warped disk (see Fig. 2), we note that this result, especially the warp strength, is uncertain due to insufficient resolution.
We reproduce the present-day disk mass, but our simulated disk likely represents an early stage subject to subsequent evolution. The observed disk may have lost mass via viscous evolution, photoevaporation, and accretion. Dust growth and drift may influence the continuum emission. Being at an earlier stage, our disk should have a higher mass than the present-day value. However, the final disk mass is a function of the initial cloudlet mass, which is a free parameter in our setup and could be increased accordingly. We note that an expanding cloudlet is a considerable simplification of ISM conditions, where mass is lost during the expansion and resulting outflow at the boundaries. However, this is considered in our choice of the initial cloudlet mass. The extended density structure that is the result of the full engulfment of the system in cloudlet gas during the initial encounter could be seen as representative of Bondi-Hoyle accretion in a filamentary structure, which is likely the dominant type of environmental interaction (Winter et al. 2024; Pelkonen et al. 2025)
Finally, the proposed late accretion event is not the only possible explanation for the observed system configuration. A stellar flyby could cause a misalignment, though it would likely perturb the rest of the system (Nealon et al. 2025). Future work to confirm the position angle of the binary and planetary orbits with high precision will help distinguish between scenarios. Speculatively, the giant planet could also form in the accreted warped disk and become misaligned relative to the outer disk regions if formed in the inner disk regions for sufficient warp strength. However, planet formation in a warped disk is not a well-studied topic, and we do not explore this idea further here.
4.3. A circumsecondary disk
Our simulation reveals an additional, previously unexplored, feature of the system: a disk around the secondary. The accretion of mass around this star is inevitable if a late infall event is responsible for the misaligned disk around the primary. Observationally, its existence is unknown. Previous ALMA observations were not suitable to detect it. First, their sensitivity was too shallow to detect the circumsecondary disk, which is less massive than the circumprimary disk and accretes onto the secondary on a shorter timescale. Second, the maximum recoverable scale of the chosen configuration was only ∼2.1″, smaller than the binary separation, so that extended emission like a connection arc would have been missed. A deeper observation with a higher maximum recoverable scale, aimed at discovering this disk, could shed important light on the plausibility of a late infall event causing the observed disk-planet misalignment, offering broader insights into protoplanetary disk evolution and planet formation.
We find that the orientation of this disk is different from the primary disk, that it is evolving more quickly over time, and that it is connected to the primary through an arc of material with episodic mass transfer events. This is due to the mass ratio of the binary stars, Ms/M⋆ = 0.24. For the less massive secondary, the instantaneous rest frame changes more rapidly with orbital phase due to the larger semimajor axis around the barycenter. Therefore, the angular momentum of the cloudlet relative to the secondary star, determining the disk orientation, evolves more strongly, and differs from the circumprimary disk. The simulation does not resolve the circumsecondary disk in detail, but it could serve as a test bed for future studies on circumstellar disks heavily influenced by binary interactions and their environment.
5. Conclusion
In this letter we proposed that the existence of a transition disk around IRAS 04125+2902 that is misaligned with respect to the other edge-on system components could be explained by the accretion of a gas cloudlet whose orbital plane is misaligned with respect to the system’s original angular momentum. A 3D hydrodynamical simulation with a simplistic setup can reproduce relevant aspects of the system’s configuration, misalignment, and mass, despite the gravitational interaction with the secondary star. While a perfect match is not expected with our setup, and more detailed studies of the parameter space and the subsequent disk evolution after the accretion event may lead to a closer match. The formation of second-generation protoplanetary disks with random orientation is a natural outcome of late-accretion onto a system, and does not perturb the configuration of existing planets or binary orbits.
Our work serves as a proof of concept demonstrating that material inflowing from the larger-scale environment is imperative to consider when investigating disk-planet misalignment, and protoplanetary disk evolution in general.
Data availability
Movie is available at https://www.aanda.org
Acknowledgments
We thank the anonymous referee for their thoughtful comments that helped greatly improved the manuscript. L.-A. H. acknowledges funding by the DFG via the Heidelberg Cluster of Excellence STRUCTURES in the framework of Germany’s Excellence Strategy (grant EXC-2181/1 – 390900948). The authors acknowledge support by the High Performance and Cloud Computing Group at the Zentrum für Datenverarbeitung of the University of Tübingen, the state of Baden-Württemberg through bwHPC and the German Research Foundation (DFG) through grants INST 35/1134-1 FUGG, 35/1597-1 FUGG, 37/935-1 FUGG and INST 37/1159-1 FUGG.
References
- Barber, M. G., Mann, A. W., Vanderburg, A., et al. 2024, Nature, 635, 574 [NASA ADS] [CrossRef] [Google Scholar]
- Benítez-Llambay, P., & Masset, F. S. 2016, ApJS, 223, 11 [Google Scholar]
- Bitsch, B., & Kley, W. 2011, A&A, 530, A41 [NASA ADS] [CrossRef] [EDP Sciences] [Google Scholar]
- Bitsch, B., Lambrechts, M., & Johansen, A. 2015, A&A, 582, A112 [NASA ADS] [CrossRef] [EDP Sciences] [Google Scholar]
- Bosschaart, Q., Guerra-Alvarado, O. M., van der Marel, N., & Mulders, G. D. 2025, A&A, submitted [Google Scholar]
- Calcino, J., Price, D. J., Hilder, T., et al. 2025, MNRAS, 537, 2695 [Google Scholar]
- Christian, S., Vanderburg, A., Becker, J., et al. 2022, AJ, 163, 207 [NASA ADS] [CrossRef] [Google Scholar]
- Clarke, C. J., & Pringle, J. E. 1993, MNRAS, 261, 190 [Google Scholar]
- Crida, A., Baruteau, C., Griveaud, P., et al. 2025, arXiv e-prints [arXiv:2506.23331] [Google Scholar]
- Drążkowska, J., & Dullemond, C. P. 2018, A&A, 614, A62 [NASA ADS] [CrossRef] [EDP Sciences] [Google Scholar]
- Drążkowska, J., Bitsch, B., Lambrechts, M., et al. 2023, in Protostars and Planets VII, eds. S. Inutsuka, Y. Aikawa, T. Muto, K. Tomida, & M. Tamura, ASP Conf. Ser., 534, 717 [Google Scholar]
- Dullemond, C. P., Küffmeier, M., Goicovic, F., et al. 2019, A&A, 628, A20 [NASA ADS] [CrossRef] [EDP Sciences] [Google Scholar]
- Espaillat, C., Andrews, S., Powell, D., et al. 2015, ApJ, 807, 156 [Google Scholar]
- Garufi, A., Ginski, C., van Holstein, R. G., et al. 2024, A&A, 685, A53 [NASA ADS] [CrossRef] [EDP Sciences] [Google Scholar]
- Ginski, C., Facchini, S., Huang, J., et al. 2021, ApJ, 908, L25 [NASA ADS] [CrossRef] [Google Scholar]
- Hanawa, T., Garufi, A., Podio, L., Codella, C., & Segura-Cox, D. 2024, MNRAS, 528, 6581 [NASA ADS] [CrossRef] [Google Scholar]
- Hopkins, P. F. 2015, MNRAS, 450, 53 [Google Scholar]
- Kimmig, C. N., & Dullemond, C. P. 2024, A&A, 689, A45 [NASA ADS] [CrossRef] [EDP Sciences] [Google Scholar]
- Kuffmeier, M., Goicovic, F. G., & Dullemond, C. P. 2020, A&A, 633, A3 [NASA ADS] [CrossRef] [EDP Sciences] [Google Scholar]
- Kuffmeier, M., Dullemond, C. P., Reissl, S., & Goicovic, F. G. 2021, A&A, 656, A161 [NASA ADS] [CrossRef] [EDP Sciences] [Google Scholar]
- Lebreuilly, U., Hennebelle, P., Colman, T., et al. 2024, A&A, 682, A30 [NASA ADS] [CrossRef] [EDP Sciences] [Google Scholar]
- Lenz, C. T., Klahr, H., Birnstiel, T., Kretke, K., & Stammler, S. 2020, A&A, 640, A61 [NASA ADS] [CrossRef] [EDP Sciences] [Google Scholar]
- Luhman, K. L. 2025, AJ, 169, 179 [Google Scholar]
- Mamajek, E. E. 2009, in Exoplanets and Disks: Their Formation and Diversity, eds. T. Usuda, M. Tamura, & M. Ishii, AIP Conf. Ser., 1158, 3 [NASA ADS] [CrossRef] [Google Scholar]
- Marzari, F., & Nelson, A. F. 2009, ApJ, 705, 1575 [NASA ADS] [CrossRef] [Google Scholar]
- Masset, F. 2000, A&AS, 141, 165 [NASA ADS] [CrossRef] [EDP Sciences] [Google Scholar]
- Nealon, R., Cuello, N., & Alexander, R. 2020, MNRAS, 491, 4108 [NASA ADS] [Google Scholar]
- Nealon, R., Smallwood, J. L., Aly, H., et al. 2025, arXiv e-prints [arXiv:2504.07182] [Google Scholar]
- Palmeirim, P., André, P., Kirk, J., et al. 2013, A&A, 550, A38 [NASA ADS] [CrossRef] [EDP Sciences] [Google Scholar]
- Papaloizou, J. C. B., Korycansky, D. G., & Terquem, C. 1995, Ann. New York Acad. Sci., 773, 261 [Google Scholar]
- Pelkonen, V. M., Padoan, P., Juvela, M., Haugbølle, T., & Nordlund, Å. 2025, A&A, 694, A327 [NASA ADS] [CrossRef] [EDP Sciences] [Google Scholar]
- Pineda, J. L., Goldsmith, P. F., Chapman, N., et al. 2010, ApJ, 721, 686 [NASA ADS] [CrossRef] [Google Scholar]
- Shakura, N. I., & Sunyaev, R. A. 1973, A&A, 24, 337 [NASA ADS] [Google Scholar]
- Shoshi, A., Muto, T., Bosschaart, Q., et al. 2025, arXiv e-prints [arXiv:2509.01896] [Google Scholar]
- Speedie, J., Dong, R., Teague, R., et al. 2025, ApJ, 981, L30 [Google Scholar]
- Tanaka, H., & Ward, W. R. 2004, ApJ, 602, 388 [Google Scholar]
- Winter, A. J., Benisty, M., & Andrews, S. M. 2024, ApJ, 972, L9 [NASA ADS] [CrossRef] [Google Scholar]
- Xiang-Gruess, M., & Papaloizou, J. C. B. 2013, MNRAS, 431, 1320 [Google Scholar]
- Zanazzi, J. J., & Lai, D. 2017, MNRAS, 467, 1957 [Google Scholar]
- Zanazzi, J. J., & Lai, D. 2018, MNRAS, 477, 5207 [NASA ADS] [CrossRef] [Google Scholar]
For a video, see online material.
Appendix A: ALMA observation of the circumstellar disk around IRAS 04125+2902
To determine the extent of the gas disk around the primary star, and to compare the disk arising in the simulation to the highest resolution images available, we show the ALMA observation of IRAS 04125+2902 (2022.1.01302.S, PI: G. Mulders, Bosschaart et al. 2025; Shoshi et al. 2025) in Fig. A.1. A clear transition disk can be seen, with an inner cavity reaching out to ∼20 AU and an outer dust disk out to ∼40AU. This data confirms the inclination of id ≈ 30° based on the low-resolution SMA observation (Espaillat et al. 2015). Using the peak intensity of the CO emission, we find that the gas component extends out to ∼120 AU.
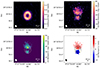 |
Fig. A.1. ALMA Band 6 observations of the circumstellar disk around the primary. The contour lines show the 10σ and 15σ continuum emission. The top left panel shows the 1.3 mm continuum emission map, the top right panel the CO peak intensity map, the bottom left panel the CO moment 0 map, and the bottom right panel the CO moment 1 map. |
Appendix B: Mass of second-generation disks
The total gas mass of the disk around the primary is different from the initial cloudlet mass. Leftover gas with a total mass of Mrest = 2.2 × 10⁻³ M⊙ is bound to the binary system at the end of the simulation, subject to eventual accretion in subsequent evolution. A significant fraction of gas is lost as a result of the cloudlet expansion, Mlost = 1.2 × 10⁻² M⊙, implying an accretion efficiency of 27%. Some accreted material also forms a circumsecondary disk. The time evolution of the gas disk masses around both stars and the total mass of gas bound to the binary system is shown in Fig. B.1. Gas bound to the secondary,  and within its Hill radius rH was considered part of its disk. Here, v is the speed of the gas parcel, and r and rs are the location vectors of the gas parcel and the secondary, respectively. Mass bound to the primary and inside a sphere with radius abin, with abin the binary orbit semimajor axis around the origin was considered as part of the primary disk.
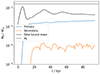 |
Fig. B.1. Total masses of the primary (blue line) and secondary (orange line) disks, as well as the initial cloudlet mass Mc (dashed black line) and total mass of bound gas (solid black line). |
The steady increase in disk mass over time is related to the fallback of mass left over from the initial accretion event, whereas the oscillations of the disk masses indicate episodic mass transfer between the two disks. Both effects contribute to the overall disk orientation and its warp. At the end of the simulation, the primary disk mass is ∼2.1 × 10⁻³ M⊙, consistent with values obtained using millimeter flux (Barber et al. 2024). The ratio of the disk masses is Md, secondary/Md, primary ∼ 4.5%.
Appendix C: Time evolution of the simulation
Figure C.1 shows nine snapshots of the gas column density found in the simulation. It can be seen that both the primary and secondary star accrete matter from the encounter with the cloud, forming disks with different orientations, though the resolution is not high enough to fully resolve the secondary disk. Even though the secondary regularly perturbs the primary disk while it is still accreting leftover material, interactions become less severe over time, eventually resulting in the final misaligned disk.
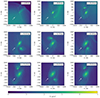 |
Fig. C.1. Time series of the gas column density found in the simulation. The camera perspective is chosen as in Fig. 1. The white arrows denote the initial infall direction, and the dashed white line represents the orbit of the secondary star. |
Appendix D: Proposed system formation scenario
Based on the late infall scenario presented in this letter, we show a potential full system evolutionary scenario as a sketch in Fig. D.1, taking place over the system’s 3 Myr lifetime (Luhman 2025). Initially, the system was created from a natal molecular cloud, inheriting the angular momentum from it, and thereby forming a primordial protoplanetary disks around each star in an aligned edge-on configuration. The transiting giant planet observed via transit events forms in the disk around the primary star, while the disk evolves and loses mass through mechanisms such as accretion and photoevaporative or magnetic winds.
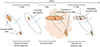 |
Fig. D.1. Formation and evolution of the IRAS 04125+2902 and companion binary system in the scenario that a late infall event is the cause of the observed misaligned transition disk. The various evolutionary stages over time are depicted from left to right. The blue arrows denote the original angular momentum vector orientation of the natal cloud and the resulting primordial system. The dashed and dotted black lines represent the orbits of the giant planet and companion star. The orange colored areas represent gas in the form of protoplanetary disks or a cloudlet. The green arrows indicate one representation of the random alignment of the second-generation disks expected from the accretion event. The scenario is exaggerated; in reality, at least some material from the first-generation disk will likely be left over after the accretion event. |
Subsequently, the system encounters a gas cloud or, more generally, an overdensity caused by ISM turbulence. Observations of the Taurus star-forming region (Garufi et al. 2024) may indicate that such environmental interactions are ubiquitous, making it possible for a cloudlet encounter to occur at the required time. As a result, two new, second-generation disks are accreted onto the two stars, whose first-generation disks may have already lost a considerable amount of mass depending on the timing of the encounter and the mass loss rate. Their orientation is random compared to the primordial configuration as the material’s origin is unrelated to the natal cloud. It may not be necessary for the first-generation disks to have lost the majority of its mass at this point; a cloudlet encounter with an existing primordial disk could lead to a broken disk where each component maintains its alignment (Kuffmeier et al. 2021), and the inner disk could continue to dissipate after the encounter, eventually resulting in the observed present-day inner cavity. A leftover primordial disk would aid the formation of the inner cavity, which would otherwise require processes like photoevaporation operating on longer timescales.
Previous work suggests that planetesimals, acting as the seeds for planets to grow by pebble accretion, form early and quickly (Lenz et al. 2020; Drążkowska & Dullemond 2018). In that case, a planet could grow to a mass of 0.3 MJ during < 1 Myr (Bitsch et al. 2015), depending on parameters like the location of the seed and the pebble flux. Observations indicate that ∼30% of disks may have dissipated after 1Myr (Mamajek 2009). If the disk has not fully dissipated, a viscous or magneto-hydrodynamical disk wind α{SS, DW} = 2 × 10⁻³ would be required to clear a 20 AU cavity in 2 Myr. Here, we assumed that the disk is broken with no supply from the outer disk. For the proposed chain of events to be feasible, early planetesimal formation and sufficient solid availability is required. Therefore, the scenario is favored if planet formation starts early, that is, before the Class II evolutionary stage of the disk. Furthermore, disks at this stage are more compact (Lebreuilly et al. 2024), so that the cavity could indeed be a result of a broken inner disk.
Additionally, the two second-generation disks are misaligned with respect to each other due to the orbital motion of the secondary and large physical separation between the two stars. The accretion event does not perturb the alignment of the binary orbit, which differentiates this scenario from a gravitational interaction with a third star. To arrive at the transition disk that is observed today, further disk evolution may take place, which does not affect the disks’ orientation, so that the misalignment caused by the accretion is kept.
Appendix E: Simulation focused on high colatitude resolution
We performed a simulation whose setup is identical to the one described in Sect. 2, but with changed resolution. In order to verify the robustness of the binary-disk misalignment against grid-related effect, we chose Nr = 140, Nθ = 440, and Nϕ = 140 to emphasize the resolution in colatitude. In doing so, we achieve eight cells per scale height at 10 AU (12 at 50 AU), or a resolution of Δϕ = 2.6°, Δθ = 0.32°, and Δr/r = 0.044. While the results are qualitatively similar, we find some differences between the simulations, shown in Fig. E.1.
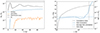 |
Fig. E.1. Disk and total bound mass time evolution and primary disk alignment resulting from the simulation focusing on high colatitude resolution. Left: As in Fig. B.1. Right: As in Fig. 2, but with an adapted vertical axis range. |
First, the distribution of material between primary and secondary disk at the end of the simulation is different. This is shown in the left panel of Fig. E.1. Here, the secondary disk is more massive, Md, s = 2 × 10⁻⁴ M⊙. The resulting mass fraction between the two disks is 9.4%, which is a factor ∼2 larger than what we find for the simulation with balanced resolution. This value is slightly higher than estimated from the ratio of Bondi accretion rates, Ṁbondi,s/Ṁbondi,p ≈ 6%. The leftover mass is Mrest = 1.9 × 10⁻³ M⊙ here, implying the same accretion efficiency as in the simulation with balanced resolution, 27%.
Second, the mass-weighted average of the disk orientation is lower than for the simulation with balanced resolution,  . Because this value is still consistent with the observed value within 1σ, we conclude that our main result does not depend on the choice of the resolution. However, the radial profile of the orientation differs. As shown in the right panel of Fig. E.1, the disk warp is significantly less pronounced. In particular, the lower misalignment between the binary orbit and the inner disk regions, as well as the steep increase in misalignment with radius, are not recovered.
All Figures
|
Fig. 1. Gas column density at tend = 94.8 kyr. The camera angle is such that the position angle of the binary orbit corresponds to the observed value. The orbit is indicated by the white dotted line, and the white arrows indicate the initial infall direction. |
| In the text | |
|
Fig. 2. Orientation of the primary disk. The angle between the angular momentum vector of a ring at the radius indicated on the horizontal axis and the binary orbit is shown as a solid blue line. The mass-weighted average value is given by the dashed blue line. For reference, the disk’s cumulative mass is indicated by the dashed black line, whereas the dotted vertical black line denotes the limiting radius for the mass-weighting. |
| In the text | |
|
Fig. A.1. ALMA Band 6 observations of the circumstellar disk around the primary. The contour lines show the 10σ and 15σ continuum emission. The top left panel shows the 1.3 mm continuum emission map, the top right panel the CO peak intensity map, the bottom left panel the CO moment 0 map, and the bottom right panel the CO moment 1 map. |
| In the text | |
|
Fig. B.1. Total masses of the primary (blue line) and secondary (orange line) disks, as well as the initial cloudlet mass Mc (dashed black line) and total mass of bound gas (solid black line). |
| In the text | |
|
Fig. C.1. Time series of the gas column density found in the simulation. The camera perspective is chosen as in Fig. 1. The white arrows denote the initial infall direction, and the dashed white line represents the orbit of the secondary star. |
| In the text | |
|
Fig. D.1. Formation and evolution of the IRAS 04125+2902 and companion binary system in the scenario that a late infall event is the cause of the observed misaligned transition disk. The various evolutionary stages over time are depicted from left to right. The blue arrows denote the original angular momentum vector orientation of the natal cloud and the resulting primordial system. The dashed and dotted black lines represent the orbits of the giant planet and companion star. The orange colored areas represent gas in the form of protoplanetary disks or a cloudlet. The green arrows indicate one representation of the random alignment of the second-generation disks expected from the accretion event. The scenario is exaggerated; in reality, at least some material from the first-generation disk will likely be left over after the accretion event. |
| In the text | |
|
Fig. E.1. Disk and total bound mass time evolution and primary disk alignment resulting from the simulation focusing on high colatitude resolution. Left: As in Fig. B.1. Right: As in Fig. 2, but with an adapted vertical axis range. |
| In the text | |
Current usage metrics show cumulative count of Article Views (full-text article views including HTML views, PDF and ePub downloads, according to the available data) and Abstracts Views on Vision4Press platform.
Data correspond to usage on the plateform after 2015. The current usage metrics is available 48-96 hours after online publication and is updated daily on week days.
Initial download of the metrics may take a while.