Fig. 1
Download original image
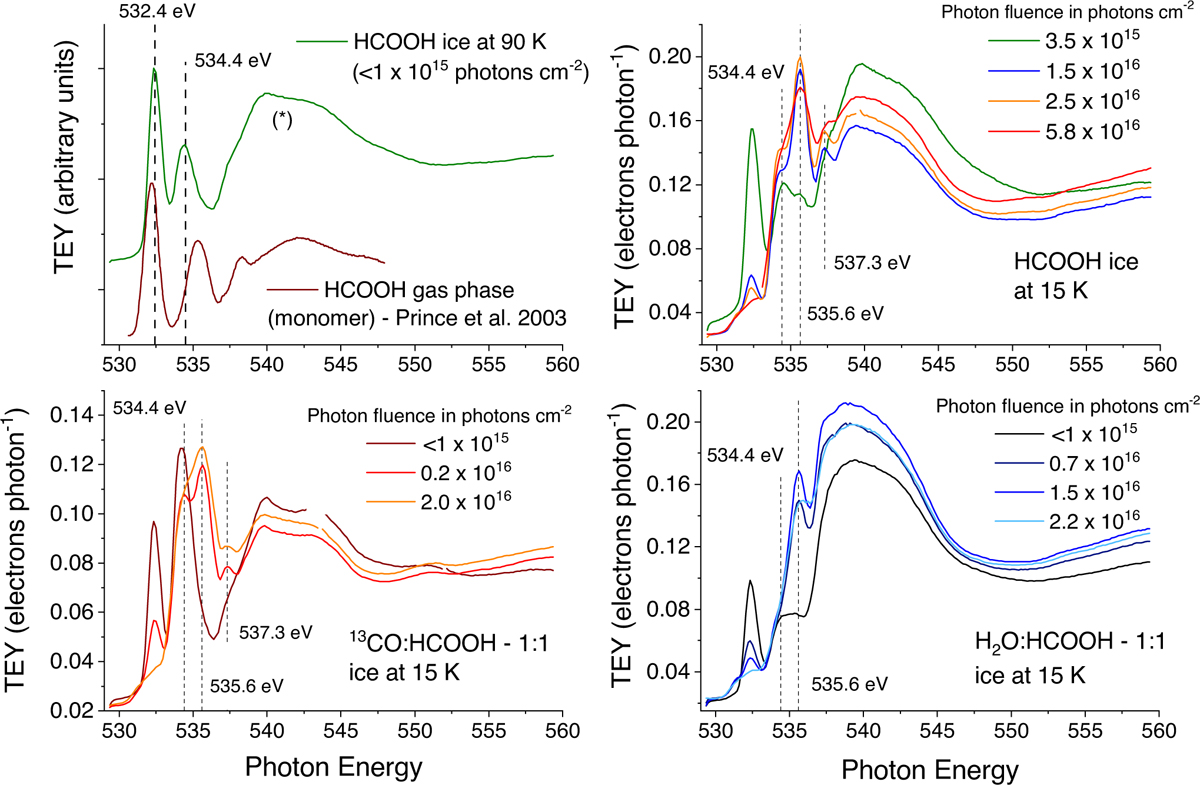
TEYs near the O K-edge measured for a pure HCOOH ice at 90 K (top left panel) and 15 K (top right panel), a 13CO:HCOOH ice−1:1 ice at 15 K (bottom left panel), and a H2O:HCOOH−1:1 ice at 15 K (bottom right panel). The displayed photon fluence represents the fluence received by the ice prior to measurement, except for cases in which it is indicated as <1 × 10¹⁵ photons cm−2. In these instances, the TEY was measured immediately after deposition and the value of 1 × 10¹⁵ photons cm−2 corresponds to the fluence received by the ice at the end of the TEY scan. The ice thickness is equivalent to ~100 ML. The top left panel also shows the X-ray absorption spectrum of gas phase HCOOH taken from Prince et al. (2003).
Current usage metrics show cumulative count of Article Views (full-text article views including HTML views, PDF and ePub downloads, according to the available data) and Abstracts Views on Vision4Press platform.
Data correspond to usage on the plateform after 2015. The current usage metrics is available 48-96 hours after online publication and is updated daily on week days.
Initial download of the metrics may take a while.