| Issue |
A&A
Volume 701, September 2025
|
|
|---|---|---|
| Article Number | A251 | |
| Number of page(s) | 10 | |
| Section | Interstellar and circumstellar matter | |
| DOI | https://doi.org/10.1051/0004-6361/202555420 | |
| Published online | 22 September 2025 | |
X-ray photodesorption of complex organic molecules in protoplanetary disks
II. Formic acid, HCOOH
1
Sorbonne Université, Observatoire de Paris, Université PSL, CNRS, LERMA,
75005
Paris,
France
2
Université Paris-Saclay, CNRS, ISMO,
91405
Orsay,
France
★ Corresponding author: This email address is being protected from spambots. You need JavaScript enabled to view it.
Received:
7
May
2025
Accepted:
17
July
2025
Abstract
Context. Nonthermal desorption from interstellar ices induced by X-rays, known as X-ray photodesorption, is a possible route to explain gas phase molecules detected in protoplanetary disks. However, the efficiency of such a process remains to be quantified for organic molecules, such as formic acid, HCOOH.
Aims. We experimentally estimate the X-ray photodesorption yields of intact HCOOH and its photoproducts from its pure ice and when it is mixed in CO-dominated and H2O-dominated ices.
Methods. Ices were grown in an ultrahigh vacuum setup and soft X-rays (530–560 eV) from the SEXTANTS beamline of the SOLEIL synchrotron facility were used to irradiate the ices at 15 K. X-ray photodesorption from the ices was probed in the gas phase of the chamber via quadrupole mass spectrometry. X-ray photodesorption yields were derived from the mass signals; they are expressed in molecules desorbed per incident photon, denoted as molecules photon−1 in the manuscript. They were extrapolated and averaged in the 0.53–10 keV range in order to provide yields that can be easily implemented in astrochemical models, referred to as astrophysical yields in the following.
Results. X-ray photodesorption of intact HCOOH at 560 eV is found to be close to our detection limit of 10−3 molecules photon−1 for pure and mixed-CO ices. When mixed in H2O ices, no clear desorption signal of intact HCOOH is observed. X-ray photodesorption yields of the HCOOH photoproducts, which we attribute to H2O, CO, CO2, HCO, H2CO, and O2, are derived as a function of the ice composition. Possible factors that may explain the relative intensities of the yields are discussed. The astrophysical yields of intact HCOOH from CO-dominated ices vary from ~10−3 to ~5 × 10⁻⁶ molecules photon−1 depending on the region of the disk considered. Only upper limits, of the same order of magnitude, can be provided for the desorption of intact HCOOH from H2O-dominated ices.
Conclusions. X-ray photodesorption should enrich the gas phase of the cold regions of protoplanetary disks with organic molecules such as HCOOH. However, as has been suggested in previous studies on CH3OH and CH3CN, X-ray photodesorption from H2O-rich ice surfaces should be less efficient than from CO-rich ice surfaces by a factor that remains to be quantified for HCOOH.
Key words: astrochemistry / ISM: molecules
© The Authors 2025
 Open Access article, published by EDP Sciences, under the terms of the Creative Commons Attribution License (https://creativecommons.org/licenses/by/4.0), which permits unrestricted use, distribution, and reproduction in any medium, provided the original work is properly cited.
This article is published in open access under the Subscribe to Open model. This email address is being protected from spambots. You need JavaScript enabled to view it. to support open access publication.
1 Introduction
Formic acid, HCOOH, has been detected in the gas phase of several regions of the interstellar medium (ISM), in various physical conditions, such as in hot cores (Liu et al. 2001; Remijan et al. 2004) and toward cold dense cores (Vastel et al. 2014; Taquet et al. 2017). The presence of HCOOH in interstellar ices is often speculative, since the observed vibrational bands that could match laboratory data are weak and overlap with that of other complex organic molecules (COMs). For example, icy HCOOH was tentatively detected in the observational studies of Schutte et al. (1999) and Öberg et al. (2011). More recently, HCOOH was proposed to be a minor component of ices observed toward the IRAS 15398-3359 protostar (Yang et al. 2022) and the Ced 110 IRS4A protostar with the James Webb Telescope (Rocha et al. 2024). Despite the lack of clear observational evidence of icy HCOOH, the presence of gas phase HCOOH in the ISM is assumed to be intimately linked to interstellar ices. For instance, in the study of Favre et al. (2018) in which HCOOH is detected in the gas phase of the TW Hydrae protoplanetary disk, it is considered in the disk modeling that HCOOH forms on the surface of ices and that it is further released in the gas phase by nonthermal desorption. Nonthermal desorption processes of COMs, including chemical desorption, cosmic ray-induced desorption, vaccuum UV (VUV) photodesorption, and X-ray photodesorption, are often assumed to play a role in their gas phase presence in the cold ISM despite the fact that these processes are poorly constrained experimentally, especially for COMs. The VUV photodesorption of HCOOH from interstellar ice analogs has been previously studied experimentally (Bertin et al. 2023). It was found that the VUV photodesorption yield of intact HCOOH from CO-dominated and H2O-dominated ices was under the detection limit of this experiment, which was 10−5 desorbed molecules per incident photon. X-ray photodesorption might also play a role in the presence of gas phase HCOOH, especially in the TW Hydrae disk (Favre et al. 2018) for which the central T Tauri star emits X-rays (Kastner et al. 2002; Stelzer & Schmitt 2004). For instance, X-ray photodesorption has recently been shown to influence the abundances of gas phase water in the protoplanetary disk modeling study of Notsu et al. (2021).
Previous work on X-ray photodesorption from interstellar ice analogs (Dupuy et al. 2018, 2021; Basalgète et al. 2022; Torres-Díaz et al. 2023) has shown that the underlying mechanism responsible for the ice-to-gas transfer in the case of X-ray photodesorption is related to the scattering of the Auger electrons toward the ice surface. These Auger electrons refer to the electrons emitted after the relaxation of the core excited state of the molecule absorbing the X-rays. They carry a kinetic energy of several hundred electronvolts depending on the incident photon energy and they induce the ionization of species in their scattering path, generating a cascade of secondary low-energy electrons that can excite electronic states of molecules near the ice surface, inducing their desorption, a mechanism known as X-ray electron-stimulated desorption (XESD).
In Paper I (Basalgète et al. 2023), we studied the X-ray photodesorption from acetonitrile-containing ices, quantified the desorption yields for intact acetonitrile and its photoproducts, and found that they depend on the ice composition. In a continuation of Paper I and previous work (Dupuy et al. 2018, 2021; Basalgète et al. 2021a,b, 2022), we aim to understand the role of the X-rays emitted by pre-main-sequence (PMS) stars in the nonthermal desorption of organic molecules from interstellar ices. This paper deals with the experimental X-ray photodesorption of HCOOH from its pure ice and from interstellar ice analogs for which HCOOH is mixed with either CO or H2O. These simple mixtures serve as model ices that represent different regions of the disks; namely, beyond water or CO snowlines. The study is conducted in the soft X-ray range, near the O K-edge region (530–560 eV), with the synchrotron light of the SOLEIL synchrotron facility in France. In Section 2, the experimental setup and the methodology are described. In Section 3, we discuss the X-ray-induced dissociation of HCOOH in the studied ices and we derive the X-ray photodesorption yields of various attributed species in the soft X-ray range. Then, in Section 4 we extrapolate the yields to higher energy (in the 0.53–10 keV range) in order to provide yields averaged over the X-ray emission spectrum of PMS stars. These latter yields are referred to as astrophysical yields in this study. The astrophysical implications are also discussed and a comparison is made with previous experimental work on the photodesorption of COMs.
2 Experimental procedure
The experiments are detailed in Paper I (Basalgète et al. 2023) and briefly summarized in the following. The SPICES (Surface Processes and ICES) ultrahigh vacuum (UHV, base pressure of ~10−10 Torr) setup is connected to the SEXTANTS beamline (Sacchi et al. 2013) of the SOLEIL synchrotron facility (Saint-Aubin, France). The ices are grown by vapor deposition on a rotatable copper substrate (polycrystalline oxygen-free high-conductivity copper) mounted on a sample holder that can be cooled down to 15 K by a closed-cycle helium cryostat. The substrate is electrically insulated from its sample holder by a Kapton foil, which enables the measurement of the total electron yield (TEY) expressed in electrons per incident photon (electrons photon−1 in the following). The TEY is sensitive to the changes in the molecular composition near the ice surface with the ongoing irradiation, i.e., with the photon fluence (expressed in photons cm−2) and it is similar to the X-ray absorption spectrum of the studied ices. “Near the ice surface” refers here to the ice depth probed by the TEY measurements, which is estimated to be a few tens of monolayers (MLs) based on studies of water ice (Tîmneanu et al. 2004) and of CO/N2 ices (Basalgète et al. 2022). Pure formic acid, HCOOH (98% purity, Sigma-Aldrich), ices were deposited and irradiated at 15 K. In order to grow binary ices, gases were mixed in the gas line prior to injection into the UHV chamber. Mixed 13CO:HCOOH ices (13CO from 99% 13C purity Eurisotop) were deposited and irradiated at 15 K. Mixed H2O:HCOOH ices (H2O from liquid chromatography standard Fluka) were deposited at 90 K, cooled down to 15 K, and irradiated at 15 K. This ensures that the resulting water ice is in its compact amorphous phase, referred to as compact amorphous solid water (c-ASW). The thickness of the ices grown is expressed in MLs, equivalent to a surface density of ~1015 molecules cm−2. Temperature-programmed desorption (TPD) experiments conducted prior to the presented studies enable one to control the number of MLs deposited with an absolute uncertainty of about 10% by relating the integrated QMS dosing signal during deposition to the actual number of deposited MLs deduced from TPD (see Doronin et al. (2015) for details). The relative proportions of the species in the deposited binary ices (displayed x:y in the following) were computed using these calibrated dosing signals. Relative proportions are thus given with an uncertainty of ~20%. The thickness of each ice deposit is approximately 100 ML.
X-rays in the O K edge region (525–560 eV) with a spectral width of 1.2 eV were routed to the UHV chamber to irradiate the grown ices. The photon flux was measured by a calibrated silicon photo-diode mounted on the beamline and it varies from 1012 to 1013 photons s−1 depending on the photon energy and the beamline experimental conditions. The beam was sent at a 47° incidence relative to the normal of the substrate surface and the spot area at the surface was ~0.1 cm2. To calibrate the energy scale, the TEY feature corresponding to the O 1s → π* transition of CO measured on a pure CO ice was centered at 534.4 eV, according to Jugnet et al. (1984).
The X-ray-induced desorbing neutral species were probed in the gas phase of the UHV chamber by a quadrupole mass spectrometer (QMS, Pfeiffer Prisma, m/z range 1–100 u) equipped with an electron impact ionization chamber (at 70 eV). The X-ray photodesorption was observed by following the changes in the mass signals with the irradiation, either by (i) irradiating the ices for a few tens of seconds, which results in mass signals similar to what is displayed in Figures 3 and 5, or (ii) continuously scanning the photon energy while irradiating the ices. X-ray photodesorption yields for each attributed species were derived from the mass signals by taking into account the photon flux and a calibrated factor that enables one to estimate the number of molecules at the QMS entrance, as is described in Paper I (Basalgète et al. 2023). The fragmentation of the species due to their electron impact ionization was taken into account when needed, by considering the mass spectra of the NIST (Linstrom & Mallard 2022). Differences in the electron-impact ionization cross sections, as well as differences in the m/z detection sensitivity of our QMS, were taken into account when deriving the X-ray photodesorption yields. The ionization cross sections were taken from the literature for HCOOH (Zawadzki 2018), H2O, CO, CO2 (Orient & Strivastava 1987), H2CO (Vacher et al. 2009), and O2 (Straub et al. 1996). The ionization cross section of HCO radical was assumed to be equal to that H2CO to quantify its desorption yields. Astrophysical relevant yields were derived from the experimental X-ray photodesorption yields, as is described in Paper I (Basalgète et al. 2023), i.e., by (i) extrapolating the yields above 560 eV, assuming that they follow the X-ray absorption of the ice, which is assimilated into the O 1s ionization cross section taken from Berkowitz (2002), and (ii) averaging the resulting X-ray photodesorption spectra (in the 0.53–10 keV range) on local X-ray spectra expected in different regions of protoplanetary disks (Nomura et al. 2007; Bethell & Bergin 2011).
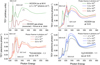 |
Fig. 1 TEYs near the O K-edge measured for a pure HCOOH ice at 90 K (top left panel) and 15 K (top right panel), a 13CO:HCOOH ice−1:1 ice at 15 K (bottom left panel), and a H2O:HCOOH−1:1 ice at 15 K (bottom right panel). The displayed photon fluence represents the fluence received by the ice prior to measurement, except for cases in which it is indicated as <1 × 10¹⁵ photons cm−2. In these instances, the TEY was measured immediately after deposition and the value of 1 × 10¹⁵ photons cm−2 corresponds to the fluence received by the ice at the end of the TEY scan. The ice thickness is equivalent to ~100 ML. The top left panel also shows the X-ray absorption spectrum of gas phase HCOOH taken from Prince et al. (2003). |
3 Results
3.1 Total electron yields with photon fluence
The TEYs measured from HCOOH-containing ices are displayed in Figure 1. In the top left panel are the TEYs from a pure HCOOH ice grown at 90 K in our experiment and that of gas phase HCOOH taken from Prince et al. (2003). The measurement of the TEY on the ice at 90 K was done immediately after deposition and the displayed photon fluence (1 × 10¹⁵photons cm−2) corresponds to the photon fluence at the end of the TEY scan. In this panel, the main features of the solid phase HCOOH are the peaks at 532.4 and 534.4 eV and a broad bump centered around 541 eV. According to X-ray spectroscopy studies of gas phase HCOOH (Prince et al. 2003; Tabayashi et al. 2006) whose results are compared with our TEY in the top left panel of Figure 1, the first two peaks are attributed to the ![Mathematical equation: $\[\mathrm{O} ~1{\mathrm{s}_{\mathrm{CO}}} \rightarrow \pi_{\mathrm{CO}}^{*}\]$](/articles/aa/full_html/2025/09/aa55420-25/aa55420-25-eq1.png) and
and ![Mathematical equation: $\[\mathrm{O} ~1{\mathrm{s}_{\mathrm{OH}}} \rightarrow \pi_{\mathrm{CO}}^{*}\]$](/articles/aa/full_html/2025/09/aa55420-25/aa55420-25-eq2.png) core transitions. The broad bump, appearing above the gas phase ionization thresholds of the O 1sCO and O 1sOH core electrons, could be attributed to the
core transitions. The broad bump, appearing above the gas phase ionization thresholds of the O 1sCO and O 1sOH core electrons, could be attributed to the ![Mathematical equation: $\[\mathrm{O} ~1\mathrm{s}_{\mathrm{OH}} \rightarrow \sigma_{\mathrm{CO}}^{*}\]$](/articles/aa/full_html/2025/09/aa55420-25/aa55420-25-eq3.png) shape resonance observed in gas phase HCOOH. The
shape resonance observed in gas phase HCOOH. The ![Mathematical equation: $\[\mathrm{O} ~1 \mathrm{s}_{\mathrm{CO}} \rightarrow \pi_{\mathrm{CO}}^{*}\]$](/articles/aa/full_html/2025/09/aa55420-25/aa55420-25-eq4.png) and
and ![Mathematical equation: $\[\mathrm{O} ~1{\mathrm{s}_\mathrm{OH}} \rightarrow \pi_{\mathrm{CO}}^{*}\]$](/articles/aa/full_html/2025/09/aa55420-25/aa55420-25-eq5.png) transitions of the condensed HCOOH are shifted upward by ~0.2 eV and downward by ~1 eV, respectively, compared to that of gas phase HCOOH. Similar energy shifts are observed on the total ion yield spectra of the gas phase beam study of Tabayashi et al. (2006) when going from effusive (monomeric) to cluster beam conditions. As is explained in this study, the O 1s core electron binding energies are modified by a change in the electron density around the O atoms due to the formation of hydrogen bonds when HCOOH dimerizes, which results in energy shifts for the O 1s core transitions. Differences between the TEYs taken at 90 K (top left panel of Figure 1) and 15 K (top right panel of Figure 1) are due to the X-ray processing of the ice at 15 K and discussed in the following.
transitions of the condensed HCOOH are shifted upward by ~0.2 eV and downward by ~1 eV, respectively, compared to that of gas phase HCOOH. Similar energy shifts are observed on the total ion yield spectra of the gas phase beam study of Tabayashi et al. (2006) when going from effusive (monomeric) to cluster beam conditions. As is explained in this study, the O 1s core electron binding energies are modified by a change in the electron density around the O atoms due to the formation of hydrogen bonds when HCOOH dimerizes, which results in energy shifts for the O 1s core transitions. Differences between the TEYs taken at 90 K (top left panel of Figure 1) and 15 K (top right panel of Figure 1) are due to the X-ray processing of the ice at 15 K and discussed in the following.
The evolution of the TEY with the photon fluence of a pure HCOOH ice deposited at 15 K is displayed in the top right panel of Figure 1. We observe the decrease in the HCOOH absorption feature at 532.4 eV until it reaches ~20% of its initial peak value for a photon fluence of ~5.8 × 10¹⁶ photons cm−2. The appearance of new absorption features in the TEY indicates the conversion of HCOOH to new species during the X-ray irradiation. The increasing features at 534.4 eV and 535.6 eV can be associated with the core O 1s transitions of CO and CO2, respectively (Wight & Brion 1974; Dupuy et al. 2021), which accumulate near the ice surface with the ongoing irradiation. H2O accumulation may also contribute to the broad bump centered near 541 eV that changes in intensity and shape with the photon fluence. In similar experiments, CO, CO2, and H2O are observed by infrared spectroscopy as main dissociation products in condensed HCOOH when irradiated with X-rays (Ryazantsev & Feldman 2015) and heavy ions (Andrade et al. 2013; Bergantini et al. 2014). The peak observed at 537.3 eV is close to the O 1sCO → 4s transition of HCOOH attributed by Tabayashi et al. (2006) but its variation with the photon fluence is not consistent with the other HCOOH TEY peaks. This peak therefore remains to be attributed. The TEYs of the mixed ices and their evolution with the photon fluence are displayed in the bottom panels of Figure 1. The new features appearing with the photon fluence in the mixed ices are similar to the ones in the pure HCOOH ice. The relative intensity of the CO versus CO2 TEY features depends on the ice composition. For instance, the CO feature is significantly weaker than the CO2 one in mixed H2O ices. This is discussed further in Section 3.3. In each irradiated ice, we also observe with the ongoing irradiation the appearance of a weak shoulder from roughly 530.5 eV to 531.5 eV. O2 (Kim et al. 2000) and/or H2CO (Hitchcock & Brion 1980) accumulation could contribute to explaining this feature.
In Figure 2, we plot the relative decrease in the HCOOH absorption feature at 532.4 eV as a function of the photon fluence and for the different studied ices. The first TEY measurement displayed in Figure 1 is considered in Figure 2 as a null fluence. From this plot, we can conclude that the soft X-ray-induced destruction kinetic of HCOOH does not significantly depend on the studied ice composition. This HCOOH behavior differs from that of CH3CN as discussed in Paper I (Basalgète et al. 2023). Indeed, for CH3CN, we clearly observe in the TEY data near the N K-edge that the presence of water in the binary ices tends to significantly accelerate the destruction of CH3CN with the ongoing irradiation compared to the case of the pure CH3CN and the mixed 13CO:CH3CN ices. This finding on HCOOH behavior is in line with the studies of Andrade et al. (2013) and Bergantini et al. (2014), in which the authors found that mixing HCOOH with water only slightly increases its destruction cross section by the cosmic ray analog impact compared to the case of the pure HCOOH ice, with a value on the order of 10−13 cm2. We fit an exponential decay (TEY(ϕ) = TEY(∞) + (1 − TEY(∞)) e−σd ϕ, where ϕ is the photon fluence in photons cm−2 and σd is the destruction cross section of HCOOH in cm2) through all points in Figure 2, assuming that the X-ray destruction cross section does not depend on the ice composition, and obtained σd = 1.5 ± 0.2 × 10⁻¹⁶ cm2. Considering the average photon flux per cm2 used in our experiments (2.5 × 10¹³ photons s−1 cm−2), we can deduce a photo-destruction rate of 3.8 ± 0.5 × 10⁻³ s−1.
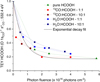 |
Fig. 2 Evolution of the HCOOH TEY feature at 532.4 eV (peak value) as a function of the photon fluence and for the different studied ices at 15 K. The first measured TEY value was set to 1 and the other values were computed relative to the first one. |
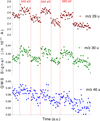 |
Fig. 3 Raw QMS signals obtained during the irradiation of an initially deposited pure HCOOH ice at 15 K and at fixed energy for the mass channels m/z 46 u, 30 u, and 29 u, associated with the X-ray photodesorption of H2CO and HCOOH (see text). The photon fluence received by the ice before the measurement was ~1 × 10¹⁶ photons cm−2. |
3.2 X-ray photodesorption from pure HCOOH ice
X-ray photodesorption signals from a pure HCOOH ice irradiated at 15 K were detected on mass channels m/z 18 u, 28 u, 29 u, 30 u, 32 u, 44 u, and 46 u. We attribute the m/z 18 u, 28 u, and 44 u, respectively, to H2O, CO, and CO2 photodesorption, consistent with the fact that these molecules have been detected as products in irradiation experiments of pure HCOOH ices by cosmic ray analogs (Andrade et al. 2013; Bergantini et al. 2014), X-rays (Ryazantsev & Feldman 2015), and low-energy electrons (Martin et al. 2008). The X-ray photodesorption of CO and CO2 is also consistent with their detection on the TEY with the ongoing irradiation, as was explained previously. The m/z 32 u could be attributed to either CH3OH or O2 photodesorption. The photodesorption of CH3OH should, however, produce a signal in the m/z 31 u due to its fragmentation in the ionization chamber of the QMS. As no signal was actually observed in the m/z 31 u channel during the experiments, we attribute the m/z 32 u to O2 photodesorption. The m/z 30 u and part of the m/z 29 u is attributed to H2CO photodesorption, although its formation was not reported in the previously cited studies. The attribution of O2 and H2CO photodesorption might be consistent with their possible detection on the TEY stated previously. After the attribution of H2CO photodesorption, we subtracted the contribution of H2CO cracking from the m/z 29 u signal using the m/z 30 u signal and the electron-impact ionization mass spectrum of H2CO from the NIST database (Linstrom & Mallard 2022). This resulted in the relative intensities of the corrected m/z 29 u and the m/z 46 u signals matching the mass spectrum of HCOOH (also taken from the NIST). We therefore attribute those signals to HCOOH photodesorption. However, it has to be noted that the photodesorption signals on the m/z 46 u are close to the noise level. Indeed, in Figure 3, we show the raw QMS signals of the m/z 46 u, 30 u, and 29 u channels monitored during step-likewise irradiation at fixed energy and for a low-processed ice (photon fluence of ~1 × 10¹⁶ photons cm−2 before measurement). The sudden increases and decreases in the m/z 30 u and 29 u signals are associated with irradiation and non-irradiation, respectively, and the corresponding photon energy is displayed in red. The photodesorption on these m/z 30 u and 29 u channels is clearly seen, whereas that of HCOOH on m/z 46 u (measured simultaneously, and hence for which the signal increase and decrease should match that of the m/z 30 u and 29 u channels) is still detectable but with a signal-to-noise ratio very close to 1.
In Table 1, we display the photodesorption yields of the different attributed species desorbing from the pure HCOOH ice at 15 K and at 560 eV. The yields were derived for a photon fluence between 1 × 10¹⁶ and 3 × 10¹⁶ photons cm−2, and hence at least 50% of the initial deposited HCOOH is dissociated according to Figure 2. Surprisingly, the X-ray photodesorption yields of CO and H2O from the pure HCOOH ice are found in the same order of magnitude as the yields from their respective pure ices, measured in similar conditions in previous experiments (0.15 molecules photon−1 at 560 eV for the X-ray photodesorption of CO from a pure CO ice at 15 K (Dupuy et al. 2021); 3.4 × 10⁻³ molecules photon−1 at 550 eV for the X-ray photodesorption of H2O from a pure H2O ice at 15 K (Dupuy et al. 2018)). This is discussed in Section 3.3.
Photodesorption spectra of CO2, CO, and H2O are displayed on Figure 4. The continuous spectra were obtained after a photon fluence of ~3 × 10¹⁶ photons cm−2, for which no HCOOH absorption features are visible in the TEY, since ~75% of the initially deposited HCOOH is dissociated at such a fluence (see Figure 2). The TEY features observed in Figure 4 are consistent with an ice composition near the surface consisting of a mix of CO, CO2, and H2O molecules. In Paper I (Basalgète et al. 2023), it was shown that X-ray photodesorption from CH3CN-containing ices likely occurs via the scattering of Auger and low-energy secondary electrons toward the ice surface after XESD. This conclusion was based on the observation that the photodesorption spectra correlated with the TEY measured simultaneously, indicating a dependence on scattering electrons. The role of Auger and secondary electrons was further supported by similarities between XESD and electron-stimulated desorption (ESD) from pure methanol ice (Torres-Díaz et al. 2023). In contrast, the photodesorption spectra shown in Figure 4 deviate from the TEY variations measured simultaneously. More precisely, near 535.6 eV, the desorption yield of CO2, CO, and H2O is higher than at 540 eV, despite similar TEY values. Such behavior, already observed on NH3 ices in previous experiments (Torres-Díaz et al. 2024), suggests contributions from non-XESD processes, whereby desorption is decorrelated from Auger and secondary electron scattering. The most probable explanation is that non-XESD processes occur at 535.6 eV, in addition to XESD. At this energy, the desorption is triggered by the photoexcitation of CO2 that is ionized and left in an excited state ![Mathematical equation: $\[\mathrm{CO}_{2}^{*+}\]$](/articles/aa/full_html/2025/09/aa55420-25/aa55420-25-eq6.png) after Auger decay. While non-XESD desorption of CO could originate from the dissociation of
after Auger decay. While non-XESD desorption of CO could originate from the dissociation of ![Mathematical equation: $\[\mathrm{CO}_{2}^{*+}\]$](/articles/aa/full_html/2025/09/aa55420-25/aa55420-25-eq7.png) into CO and O+ followed by CO desorption, non-XESD desorption of CO2 and H2O following the relaxation of
into CO and O+ followed by CO desorption, non-XESD desorption of CO2 and H2O following the relaxation of ![Mathematical equation: $\[\mathrm{CO}_{2}^{*+}\]$](/articles/aa/full_html/2025/09/aa55420-25/aa55420-25-eq8.png) near the ice surface necessarily implies other kinds of processes (see for instance Torres-Díaz et al. 2023).
near the ice surface necessarily implies other kinds of processes (see for instance Torres-Díaz et al. 2023).
X-ray photodesorption yields of intact HCOOH and fragments, from an initially deposited pure HCOOH ice.
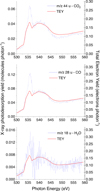 |
Fig. 4 X-ray photodesorption spectra of CO2, CO, and H2O from pure HCOOH ice at 15 K. The solid blue lines correspond to the photodesorption yields derived from continuous irradiation experiments and with a red line is also displayed the TEY measured simultaneously. The photon fluence before these measurements was ~3 × 10¹⁶ photons cm−2. |
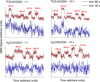 |
Fig. 5 QMS signals of the m/z 18 u (associated with H2O photodesorption, in dark red) and 46 (associated with the photodesorption of HCOOH, in dark blue) monitored during the irradiation of the mixed ices at fixed energy. The top panels display the signals from the 13CO:HCOOH (1:1 and 10:1) ices and the bottom panels display the signals from the H2O:HCOOH (1:1 and 10:1) ices. The photon fluence received by the ice before the measurements was ~1 × 10¹⁶ photons cm−2. The signals are scaled for more clarity. |
3.3 X-ray photodesorption from mixed ices
During the X-ray irradiation of the mixed ices at 15 K, we have monitored the QMS signals on the m/z channels 18 u and 46 u. Potential photodesorption signals on these mass channels are attributed to H2O and HCOOH X-ray photodesorption, respectively. We display in Figure 5 these signals for the irradiation at fixed energies. The X-ray photodesorption of H2O is clearly seen through the sudden increase and decrease in the signals on the m/z 18 u for each studied ice. As the m/z 18 u and 46 u were monitored simultaneously, the m/z 18 u serves as a reference to know at which time the increase and decrease should appear on the m/z 46 u if HCOOH photodesorption occurs. As is seen in the top panels of Figure 5, we detect the photodesorption of intact HCOOH from the mixed 13CO:HCOOH ices at several energies although the photodesorption intensity is often very close to the background level. The X-ray photodesorption of HCOOH from the mixed H2O:HCOOH ices is not clearly observed, as is seen in the bottom panels, and only an upper limit of 10−3 molecules photon−1 can be derived.
In addition to the m/z 18 u and 46 u, we also observed the QMS signals on the m/z 28 u, 29 u, 30 u, 32 u, and 44 u during the X-ray irradiation of the mixed ices. We display in Figure 6 the intensities of the mass signals at 560 eV divided by the photon flux for each studied ice. The photon fluence is in the range of ~[0.4; 3] × 1016 photons cm−2 depending on the measurement, which corresponds to a dissociation of the initially deposited HCOOH in the range of [25; 75]% before measurement according to Figure 2. For the mixed H2O:HCOOH ices, we attribute the signals observed on the m/z 18 u, 28 u, 30 u, and 44 u to H2O, 12CO, ![Mathematical equation: $\[\mathrm{H}_{2}^{12} \mathrm{CO}\]$](/articles/aa/full_html/2025/09/aa55420-25/aa55420-25-eq9.png) , and 12CO2 X-ray photodesorption. We also observed a signal on the m/z 29 u channel, which is still above the noise level after correction by the cracking of desorbing
, and 12CO2 X-ray photodesorption. We also observed a signal on the m/z 29 u channel, which is still above the noise level after correction by the cracking of desorbing ![Mathematical equation: $\[\mathrm{H}_{2}^{12} \mathrm{CO}\]$](/articles/aa/full_html/2025/09/aa55420-25/aa55420-25-eq10.png) into this mass channel. We therefore associate this remaining signal on m/z 29 u with H12CO X-ray photodesorption from the mixed-H2O ices. The m/z 32 u did not display any photodesorption signal for the H2O:HCOOH (1:1) ice and we did not monitor this channel for the H2O:HCOOH (10:1) ice. For the mixed 13CO:HCOOH ices, we attribute the signals observed on m/z 18 u, 28 u, and 44 u to H2O, 12CO, and 12CO2 X-ray photodesorption. The signals on the m/z 29 u from the 13CO:HCOOH ices are mainly due to 13CO photodesorption. Indeed, for both mixtures (1:1 and 10:1), after conversion of the intensity to a photodesorption yield, we found an X-ray photodesorption yield of 13CO from the 13CO-mixed ices close to that from a pure CO ice at 560 eV, i.e., on the order of 10−1 molecules photon−1 (Dupuy et al. 2021). The m/z 32 u signal observed on the 13CO-mixed ices could first be attributed to either methanol 12CH3OH or O2 photodesorption. Methanol photodesorption and subsequent fragmentation at the QMS entrance should produce a signal on the m/z 31 u. A photodesorption signal was detected on the m/z 31 u from the 13CO-mixed ices. However, this signal is solely attributed to the photodesorption of isotopic impurities 13C18O present in our 13CO gas sample and deposited with the 13CO matrix. Indeed the ratio of the photodesorption intensities m/z 31 u over m/z 29 u for both mixtures is consistent with the estimated amount of 13C18O impurities (~3%) measured in the mass spectrum of our 13CO gas sample. We therefore attribute the m/z 32 u signal from the 13CO-mixed ices to O2 photodesorption. The photodesorption of the 12C16O isotopic impurities present in our 13CO gas sample and deposited with the 13CO matrix is estimated as 1% of the m/z 29 u intensity and it is on the order of 10−25 A s photon−1. We can therefore neglect this contribution when looking at the m/z 28 u intensities of the 13CO-mixed ices.
into this mass channel. We therefore associate this remaining signal on m/z 29 u with H12CO X-ray photodesorption from the mixed-H2O ices. The m/z 32 u did not display any photodesorption signal for the H2O:HCOOH (1:1) ice and we did not monitor this channel for the H2O:HCOOH (10:1) ice. For the mixed 13CO:HCOOH ices, we attribute the signals observed on m/z 18 u, 28 u, and 44 u to H2O, 12CO, and 12CO2 X-ray photodesorption. The signals on the m/z 29 u from the 13CO:HCOOH ices are mainly due to 13CO photodesorption. Indeed, for both mixtures (1:1 and 10:1), after conversion of the intensity to a photodesorption yield, we found an X-ray photodesorption yield of 13CO from the 13CO-mixed ices close to that from a pure CO ice at 560 eV, i.e., on the order of 10−1 molecules photon−1 (Dupuy et al. 2021). The m/z 32 u signal observed on the 13CO-mixed ices could first be attributed to either methanol 12CH3OH or O2 photodesorption. Methanol photodesorption and subsequent fragmentation at the QMS entrance should produce a signal on the m/z 31 u. A photodesorption signal was detected on the m/z 31 u from the 13CO-mixed ices. However, this signal is solely attributed to the photodesorption of isotopic impurities 13C18O present in our 13CO gas sample and deposited with the 13CO matrix. Indeed the ratio of the photodesorption intensities m/z 31 u over m/z 29 u for both mixtures is consistent with the estimated amount of 13C18O impurities (~3%) measured in the mass spectrum of our 13CO gas sample. We therefore attribute the m/z 32 u signal from the 13CO-mixed ices to O2 photodesorption. The photodesorption of the 12C16O isotopic impurities present in our 13CO gas sample and deposited with the 13CO matrix is estimated as 1% of the m/z 29 u intensity and it is on the order of 10−25 A s photon−1. We can therefore neglect this contribution when looking at the m/z 28 u intensities of the 13CO-mixed ices.
Interpreting the variations in photodesorption intensities in Figure 6 is challenging. The measurements were made at 560 eV, an energy at which the photo-absorption is dominated by the core O 1s ionization of O-bearing molecules and is therefore similar for each ice. Surprisingly, the photodesorption intensities of both intact HCOOH and its dissociation products (H2O, 12CO, 12CO2, ![Mathematical equation: $\[\mathrm{H}_{2}^{12} \mathrm{CO}\]$](/articles/aa/full_html/2025/09/aa55420-25/aa55420-25-eq11.png) , O2) do not necessarily decrease with HCOOH dilution in mixed ices. In the following, we discuss several factors that may explain the variations in the photodesorption intensities with the ice composition. It should be noted that infrared spectroscopy studies of vapor-deposited pure formic acid ices at 15 or 18 K suggest a predominance of dimers (Cyriac & Pradeep 2005; Bisschop et al. 2007). Additionally, co-deposition with 90% CO or CO2 at 15 K reveals a spectral feature at 1154 cm−1 attributed to monomeric HCOOH (Bisschop et al. 2007). Given our similar deposition technique, we expect that HCOOH can exist as monomers, dimers, and/or chain-like structures in all studied ices with unknown proportions.
, O2) do not necessarily decrease with HCOOH dilution in mixed ices. In the following, we discuss several factors that may explain the variations in the photodesorption intensities with the ice composition. It should be noted that infrared spectroscopy studies of vapor-deposited pure formic acid ices at 15 or 18 K suggest a predominance of dimers (Cyriac & Pradeep 2005; Bisschop et al. 2007). Additionally, co-deposition with 90% CO or CO2 at 15 K reveals a spectral feature at 1154 cm−1 attributed to monomeric HCOOH (Bisschop et al. 2007). Given our similar deposition technique, we expect that HCOOH can exist as monomers, dimers, and/or chain-like structures in all studied ices with unknown proportions.
We first examine the photodesorption of intact HCOOH, which undergoes significant photodissociation under our photon fluence conditions. The TEY at a given fluence provides quantitative insights into the near-surface ice composition prior to photodesorption measurements. For instance, before the HCOOH photodesorption measurements, the fluence is similar for all mixed ices (~1.5 × 10¹⁶ photons cm−2) and higher for the pure ice (~3.0 × 10¹⁶ photons cm−2) but yielding similar HCOOH TEY values at 532.4 eV (~0.05 e− photon−1) for all studied ices. TEY spectra at such fluences also indicate that CO and CO2 are the major species near the ice surface for the initially deposited pure and 13CO-mixed ices (Figure 1), whereas H2O is the major one for the initially deposited H2O-mixed ices. This suggests that prior to photodesorption, HCOOH exists in similar amounts for all studied ices and in either a CO/CO2-rich or H2O-rich environment, with differences in binding energies likely explaining why we seem to more easily detect HCOOH photodesorption in the former case. Indeed, HCOOH can form various hydrogen bonds on water ice (Jedlovszky et al. 2008) whereas lower binding energies are expected in a CO/CO2-rich ice.
Regarding the photodesorption of species other than HCOOH, fragments desorbing directly after HCOOH dissociation should dominantly explain the photodesorption intensities on their respective mass channels at lower fluences, when HCOOH is still present in significant amounts, while species requiring surface accumulation before desorbing should dominantly explain the photodesorption intensities at higher fluences. Given the efficient dissociation of HCOOH in our photon fluence regime and the evolution of the TEY spectra with the fluence showing the accumulation of species similar to that photodesorbing, it is most likely that what we observe in Figure 6 is predominantly due to the accumulation of the species near the ice surface, which is the direct consequence of the X-ray-induced chemistry. For example, 12CO2 desorption intensities are consistent with its accumulation in similar amounts as observed in the TEY data. Indeed, CO2 photodesorption measurements were made at a photon fluence of ~2 × 10¹⁶ photons cm−2 for each ice and the TEY data at such fluence display the accumulation of 12CO2 near the ice surface with a similar TEY value for each ice (between 0.12 e− photon−1 and 0.19 e− photon−1 at 535.6 eV).
Differences in the X-ray-induced chemistry due to the ice composition therefore most likely explain the differences observed in the photodesorption intensities of products. This chemistry depends primarily on the radicals generated from HCOOH, 13CO, and H2O under X-rays and low-energy electrons and secondly on the subsequent chemical reactions. The most striking difference is the relative photodesorption intensites of the 12CO versus 12CO2 between the studied ices, which could be explained by several mechanisms. First, experimental and computational studies (Yu & Savage 1998; Akiya & Savage 1998) on the decomposition of HCOOH showed that HCOOH dehydration (HCOOH → CO + H2O) is the main pathway in the gas phase, whereas the presence of water favors HCOOH decarboxylation (HCOOH → CO2 + H2) with a catalytic behavior. This could partially explain why the 12CO photdesorption intensity is significantly lower in the water ice.
Additionally, the dissociation pathways of HCOOH depend on its molecular form (monomer, dimer, and/or chain-like structures), as was proven by previous experiments. For instance, gas-phase photodissociation studies of HCOOH monomers at 222 nm show distinct primary quantum yields for OH radical formation compared to dimers (Singleton et al. 1990). Similarly, simulations by Novak et al. (2012) demonstrated that proton transfer processes in photoexcited dimers result in dissociation pathways that differ significantly from those of monomers. In our solid-phase experiments in which several molecular forms should be present depending on the ice composition, such variations in dissociation pathways likely lead to differences in the primary products formed and subsequent chemistry, which are difficult to predict a priori but would ultimately influence the photodesorption intensities observed in Figure 6.
Other important mechanisms at play are the expected chemical reactions induced by OH and H radicals generated in the water matrix, which are absent in the other studied ices. For instance, the reduced photodesorption intensity of 12CO in H2O-mixed ices could be explained by its consumption due to reaction with OH and H radicals. Previous studies on irradiated CO:H2O ices, with 5 keV electrons (Bennett et al. 2011), 0.8 MeV protons (Hudson & Moore 1999), soft X-rays (Laffon et al. 2010), and low-energy electrons (Schmidt et al. 2019), show that such reactions lead to the formation of CO2, HCO, H2CO, CH3OH, and HCOOH. Reactions involving CO and H2CO with OH/H radicals to reform HCOOH were also proposed in the study of Qasim et al. (2019). While CH3OH and HCOOH photodesorption are not detected from our H2O-mixed ices, the photodesorption of H12CO and ![Mathematical equation: $\[\mathrm{H}_{2}^{12} \mathrm{CO}\]$](/articles/aa/full_html/2025/09/aa55420-25/aa55420-25-eq12.png) from these ices may be due to their formation by 12CO hydrogenation, as was suggested in previous studies, and subsequent desorption. The water matrix under irradiation can also act as a reducing e− + H+ environment (see Desmons et al. 2024) in which HCOOH can be reduced to H2CO. After conversion of the photodesorption intensities to photodesorption yields, we display in Table 2 the X-ray photodesorption yields at 560 eV of the attributed species from the mixed ices with the highest dilution ratios, more relevant to interstellar ices.
from these ices may be due to their formation by 12CO hydrogenation, as was suggested in previous studies, and subsequent desorption. The water matrix under irradiation can also act as a reducing e− + H+ environment (see Desmons et al. 2024) in which HCOOH can be reduced to H2CO. After conversion of the photodesorption intensities to photodesorption yields, we display in Table 2 the X-ray photodesorption yields at 560 eV of the attributed species from the mixed ices with the highest dilution ratios, more relevant to interstellar ices.
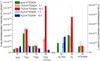 |
Fig. 6 X-ray photodesorption intensities (divided by the photon flux) associated with the m/z channels monitored during the irradiation at fixed energies from pure HCOOH ice and mixed 13CO:HCOOH and H2O:HCOOH ices. These intensities were derived at 560 eV and for an irradiation at 15 K. The photon fluence received by the ice before the measurements varies between ~4 × 10¹⁵ and ~3 × 10¹⁶ photons cm−2. |
X-ray photodesorption yields (in 10−3 molecules photon−1) of H12COOH and photo-products from initially deposited mixed 13CO:H12COOH (10:1) and H2O:H12COOH (10:1) ices.
4 Astrophysical implications
We note that the photodesorption yields in Tables 1 and 2 are given as a result of our experimental quantification. They are not necessarily directly usable in astrochemical models. We recommend instead using the yields given in Table 3 and described in the following. They consist of yields averaged over typical emission spectra of PMS stars in different locations of protoplanetary disks. They can for example be used as direct input parameters of astrochemical models, per species, per local regions of disks, and/or per ice composition to be considered.
Similarly to Paper I (Basalgète et al. 2023), we computed the astrophysical yields, as is described in Section 2. We used the X-ray emission spectrum of a classical T-Tauri star from Nomura et al. (2007) that we attenuated for a different column density of gas and dust NH by taking the attenuation cross section of Bethell & Bergin (2011). We then averaged the extrapolated X-ray photodesorption yields on these spectra for different values of NH. The results are displayed in Table 3. For the computation, we considered the X-ray photodesorption yield of HCOOH from the mixed H2O ice to be equal to its detection limit of 10−3 molecules photon−1 from 530 to 560 eV.
X-rays emitted from the PMS star should therefore participate in injecting icy HCOOH in the gas phase of protoplanetary disks. The X-ray photodesorption yields of intact HCOOH from CO-dominated ices are close to our detection limit but HCOOH photodesorption seems to be favored in CO-dominated ices compared to H2O-dominated ices. A similar trend has been observed for the X-ray photodesorption of other intact COMs, such as methanol (CH3OH) and acetonitrile (CH3CN) (see Paper I Basalgète et al. 2023 and Basalgète et al. 2021b). In these studies, the yields of intact COMs were found to be at least half an order of magnitude higher in CO-dominated ices than in H2O-dominated ices. Additionally, the X-ray photodesorption yields of HCOOH, CH3OH, and CH3CN from CO-dominated ices (measured at 560 eV or derived as astrophysical yields for equivalent NH values) fall within the same order of magnitude.
When looking at Table 2, the sum of the photodesorption yields of the 12C-bearing species is lower by a factor of 2 for the H2O-mixed ice than for the 13CO-mixed ice for the same dilution factor (10:1). Indeed, a total of ~0.11 and ~0.06 12C-bearing species are photodesorbing per incident photon from the 13CO-mixed (10:1) and H2O-mixed (10:1) ice, respectively. This suggests that the water matrix tends to be enriched in carbon species originating from the HCOOH organics compared to the case of the CO matrix for which these carbon species tend to be ejected from the ice surface.
Finally, the X-ray astrophysical photodesorption yields of intact HCOOH from CO-dominated ices measured in this study appear to be higher than the upper limit of 5 × 10⁻⁶ molecules photon−1 derived for its VUV photodesorption in (Bertin et al. 2023). This shows that X-ray photodesorption is a more efficient mechanism, by incident photon, for releasing intact HCOOH from CO-dominated ices into the gas phase than VUV photodesorption.
X-ray astrophysical photodesorption yields (in molecules photon−1) of H12COOH, 12CO, 12CO2, and H2O from CO-dominated and H2O-dominated ices, at 15 K.
5 Conclusion
The X-ray photodesorption of formic acid (HCOOH) from pure ices and binary mixtures with CO and H2O was studied to provide information on nonthermal desorption processes. The X-ray photodesorption yields of intact HCOOH from CO-dominated ices are found to be near the detection limit, while no clear photodesorption signal is observed from H2O-dominated ices. These findings highlight the influence of ice composition on the X-ray photodesorption process, consistent with previous studies on other COMs such as CH3OH and CH3CN. Astrophysical yields were derived in order to facilitate the implementation of X-ray photodesorption in astrochemical models.
Acknowledgements
This work was carried out with financial support from the Region Ile-de-France DIM-ACAV + program; the Sorbonne Université “Emergence” program; the ANR PIXyES project, Grant No. ANR-20-CE30-0018 of the French “Agence Nationale de la Recherche”; and the Program National “Physique et Chimie du Milieu Interstellaire” (PCMI) of CNRS/INSU with INC/INP cofunded by CEA and CNES. We would like to acknowledge SOLEIL for the provision of synchrotron radiation facilities under Project No. 20210142 and N. Jaouen, H. Popescu, and R. Gaudemer for their help on the SEXTANTS beamline.
References
- Akiya, N., & Savage, P. E. 1998, AIChE J., 44, 405 [Google Scholar]
- Andrade, D. P. P., de Barros, A. L. F., Pilling, S., et al. 2013, MNRAS, 430, 787 [Google Scholar]
- Basalgète, R., Dupuy, R., Féraud, G., et al. 2021a, A&A, 647, A35 [NASA ADS] [CrossRef] [EDP Sciences] [Google Scholar]
- Basalgète, R., Dupuy, R., Féraud, G., et al. 2021b, A&A, 647, A36 [EDP Sciences] [Google Scholar]
- Basalgète, R., Torres-Díaz, D., Lafosse, A., et al. 2022, JCP, 157, 084308 [Google Scholar]
- Basalgète, R., Torres-Díaz, D., Lafosse, A., et al. 2023, A&A, 676, A13 [NASA ADS] [CrossRef] [EDP Sciences] [Google Scholar]
- Bennett, C. J., Hama, T., Kim, Y. S., Kawasaki, M., & Kaiser, R. I. 2011, ApJ, 727, 27 [NASA ADS] [CrossRef] [Google Scholar]
- Bergantini, A., Pilling, S., Rothard, H., Boduch, P., & Andrade, D. P. P. 2014, MNRAS, 437, 2720 [CrossRef] [Google Scholar]
- Berkowitz, J. 2002, Atomic and Molecular Photoabsorption: Absolute Total Cross Sections (San Diego, CA: Academic Press) [Google Scholar]
- Bertin, M., Basalgète, R., Ocaña, A. J., et al. 2023, Faraday Discuss., 245, 488 [NASA ADS] [CrossRef] [Google Scholar]
- Bethell, T. J., & Bergin, E. A. 2011, ApJ, 740, 7 [NASA ADS] [CrossRef] [Google Scholar]
- Bisschop, S. E., Fuchs, G. W., Boogert, A. C. A., van Dishoeck, E. F., & Linnartz, H. 2007, A&A, 470, 749 [NASA ADS] [CrossRef] [EDP Sciences] [Google Scholar]
- Cyriac, J., & Pradeep, T. 2005, Chem. Phys. Lett., 402, 116 [Google Scholar]
- Desmons, S., Bonin, J., Robert, M., & Bontemps, S. 2024, Chem. Sci., 15, 15023 [Google Scholar]
- Doronin, M., Bertin, M., Michaut, X., Philippe, L., & Fillion, J.-H. 2015, JCP, 143, 084703 [Google Scholar]
- Dupuy, R., Bertin, M., Féraud, G., et al. 2018, Nat. Astron., 2, 796 [CrossRef] [Google Scholar]
- Dupuy, R., Bertin, M., Féraud, G., et al. 2021, PCCP, 23, 15965 [Google Scholar]
- Favre, C., Fedele, D., Semenov, D., et al. 2018, ApJ, 862, L2 [NASA ADS] [CrossRef] [Google Scholar]
- Hitchcock, A., & Brion, C. 1980, J. Electron Spectrosc. Related Phenomena, 19, 231 [Google Scholar]
- Hudson, R., & Moore, M. 1999, Icarus, 140, 451 [NASA ADS] [CrossRef] [Google Scholar]
- Jedlovszky, P., Hantal, G., Neuróhr, K., et al. 2008, JCP-C, 112, 8976 [Google Scholar]
- Jugnet, Y., Himpsel, F. J., Avouris, P., & Koch, E. E. 1984, PRL, 53, 198 [Google Scholar]
- Kastner, J. H., Huenemoerder, D. P., Schulz, N. S., Canizares, C. R., & Weintraub, D. A. 2002, ApJ, 567, 434 [Google Scholar]
- Kim, C., Jeong, H., & Kim, E. 2000, Surf. Sci., 459, L457 [Google Scholar]
- Laffon, C., Lasne, J., Bournel, F., et al. 2010, PCCP, 12, 10865 [Google Scholar]
- Linstrom, P., & Mallard, W. 2022, NIST Standard Reference Database Number 69, 20899 [Google Scholar]
- Liu, S., Mehringer, D. M., & Snyder, L. E. 2001, ApJ, 552, 654 [NASA ADS] [CrossRef] [Google Scholar]
- Martin, I., Bertin, M., Domaracka, A., et al. 2008, Int. J. Mass Spectrom., 277, 262 [Google Scholar]
- Nomura, H., Aikawa, Y., Tsujimoto, M., Nakagawa, Y., & Millar, T. J. 2007, ApJ, 661, 334 [NASA ADS] [CrossRef] [Google Scholar]
- Notsu, S., van Dishoeck, E. F., Walsh, C., Bosman, A. D., & Nomura, H. 2021, A&A, 650, A180 [NASA ADS] [CrossRef] [EDP Sciences] [Google Scholar]
- Novak, J., Mališ, M., Prlj, A., et al. 2012, JCP-A, 116, 11467 [Google Scholar]
- Öberg, K. I., Boogert, A. C. A., Pontoppidan, K. M., et al. 2011, ApJ, 740, 109 [Google Scholar]
- Orient, O. J., & Strivastava, S. K. 1987, J. Phys. B: At. Mol. Phys., 20, 3923 [NASA ADS] [CrossRef] [Google Scholar]
- Prince, K. C., Richter, R., de Simone, M., Alagia, M., & Coreno, M. 2003, JCP-A, 107, 1955 [Google Scholar]
- Qasim, D., Lamberts, T., He, J., et al. 2019, A&A, 626, A118 [NASA ADS] [CrossRef] [EDP Sciences] [Google Scholar]
- Remijan, A., Shiao, Y., Friedel, D. N., Meier, D. S., & Snyder, L. E. 2004, ApJ, 617, 384 [CrossRef] [Google Scholar]
- Rocha, W., McClure, M., Sturm, J., et al. 2024, A&A, 693, A288 [NASA ADS] [Google Scholar]
- Ryazantsev, S. V., & Feldman, V. I. 2015, PCCP, 17, 30648 [Google Scholar]
- Sacchi, M., Jaouen, N., Popescu, H., et al. 2013, J. Phys.: Conf. Ser., 425, 072018 [NASA ADS] [CrossRef] [Google Scholar]
- Schmidt, F., Swiderek, P., & Bredehöft, J. H. 2019, ACS Earth Space Chem., 3, 1974 [NASA ADS] [CrossRef] [Google Scholar]
- Schutte, W. A., Boogert, A. C. A., Tielens, A. G. G. M., et al. 1999, A&A, 343, 966 [NASA ADS] [Google Scholar]
- Singleton, D. L., Paraskevopoulos, G., & Irwin, R. S. 1990, JCP, 94, 695 [Google Scholar]
- Stelzer, B., & Schmitt, J. H. M. M. 2004, A&A, 418, 687 [NASA ADS] [CrossRef] [EDP Sciences] [Google Scholar]
- Straub, H. C., Renault, P., Lindsay, B. G., Smith, K. A., & Stebbings, R. F. 1996, Phys. Rev. A, 54, 2146 [CrossRef] [PubMed] [Google Scholar]
- Tabayashi, K., Yamamoto, K., Takahashi, O., et al. 2006, JCP, 125, 194307 [Google Scholar]
- Taquet, V., Wirström, E. S., Charnley, S. B., et al. 2017, A&A, 607, A20 [NASA ADS] [CrossRef] [EDP Sciences] [Google Scholar]
- Torres-Díaz, D., Basalgète, R., Bertin, M., et al. 2023, ChemPhysChem, 24, e202200912 [CrossRef] [Google Scholar]
- Torres-Díaz, D., Basalgète, R., Amiaud, L., et al. 2024, A&A, 690, A90 [NASA ADS] [CrossRef] [EDP Sciences] [Google Scholar]
- Tîmneanu, N., Caleman, C., Hajdu, J., & van der Spoel, D. 2004, Chem. Phys., 299, 277 [CrossRef] [Google Scholar]
- Vacher, J., Jorand, F., Blin-Simiand, N., & Pasquiers, S. 2009, Chem. Phys. Lett., 476, 178 [Google Scholar]
- Vastel, C., Ceccarelli, C., Lefloch, B., & Bachiller, R. 2014, ApJ, 795, L2 [NASA ADS] [CrossRef] [Google Scholar]
- Wight, G., & Brion, C. 1974, J. Electron Spectrosc. Related Phenomena, 3, 191 [Google Scholar]
- Yang, Y.-L., Green, J. D., Pontoppidan, K. M., et al. 2022, ApJ, 941, L13 [NASA ADS] [CrossRef] [Google Scholar]
- Yu, J., & Savage, P. E. 1998, Ind. Eng. Chem. Res., 37, 2 [Google Scholar]
- Zawadzki, M. 2018, Eur. Phys. J. D, 72, 12 [NASA ADS] [CrossRef] [Google Scholar]
All Tables
X-ray photodesorption yields of intact HCOOH and fragments, from an initially deposited pure HCOOH ice.
X-ray photodesorption yields (in 10−3 molecules photon−1) of H12COOH and photo-products from initially deposited mixed 13CO:H12COOH (10:1) and H2O:H12COOH (10:1) ices.
X-ray astrophysical photodesorption yields (in molecules photon−1) of H12COOH, 12CO, 12CO2, and H2O from CO-dominated and H2O-dominated ices, at 15 K.
All Figures
|
Fig. 1 TEYs near the O K-edge measured for a pure HCOOH ice at 90 K (top left panel) and 15 K (top right panel), a 13CO:HCOOH ice−1:1 ice at 15 K (bottom left panel), and a H2O:HCOOH−1:1 ice at 15 K (bottom right panel). The displayed photon fluence represents the fluence received by the ice prior to measurement, except for cases in which it is indicated as <1 × 10¹⁵ photons cm−2. In these instances, the TEY was measured immediately after deposition and the value of 1 × 10¹⁵ photons cm−2 corresponds to the fluence received by the ice at the end of the TEY scan. The ice thickness is equivalent to ~100 ML. The top left panel also shows the X-ray absorption spectrum of gas phase HCOOH taken from Prince et al. (2003). |
| In the text | |
|
Fig. 2 Evolution of the HCOOH TEY feature at 532.4 eV (peak value) as a function of the photon fluence and for the different studied ices at 15 K. The first measured TEY value was set to 1 and the other values were computed relative to the first one. |
| In the text | |
|
Fig. 3 Raw QMS signals obtained during the irradiation of an initially deposited pure HCOOH ice at 15 K and at fixed energy for the mass channels m/z 46 u, 30 u, and 29 u, associated with the X-ray photodesorption of H2CO and HCOOH (see text). The photon fluence received by the ice before the measurement was ~1 × 10¹⁶ photons cm−2. |
| In the text | |
|
Fig. 4 X-ray photodesorption spectra of CO2, CO, and H2O from pure HCOOH ice at 15 K. The solid blue lines correspond to the photodesorption yields derived from continuous irradiation experiments and with a red line is also displayed the TEY measured simultaneously. The photon fluence before these measurements was ~3 × 10¹⁶ photons cm−2. |
| In the text | |
|
Fig. 5 QMS signals of the m/z 18 u (associated with H2O photodesorption, in dark red) and 46 (associated with the photodesorption of HCOOH, in dark blue) monitored during the irradiation of the mixed ices at fixed energy. The top panels display the signals from the 13CO:HCOOH (1:1 and 10:1) ices and the bottom panels display the signals from the H2O:HCOOH (1:1 and 10:1) ices. The photon fluence received by the ice before the measurements was ~1 × 10¹⁶ photons cm−2. The signals are scaled for more clarity. |
| In the text | |
|
Fig. 6 X-ray photodesorption intensities (divided by the photon flux) associated with the m/z channels monitored during the irradiation at fixed energies from pure HCOOH ice and mixed 13CO:HCOOH and H2O:HCOOH ices. These intensities were derived at 560 eV and for an irradiation at 15 K. The photon fluence received by the ice before the measurements varies between ~4 × 10¹⁵ and ~3 × 10¹⁶ photons cm−2. |
| In the text | |
Current usage metrics show cumulative count of Article Views (full-text article views including HTML views, PDF and ePub downloads, according to the available data) and Abstracts Views on Vision4Press platform.
Data correspond to usage on the plateform after 2015. The current usage metrics is available 48-96 hours after online publication and is updated daily on week days.
Initial download of the metrics may take a while.