Fig. 1.
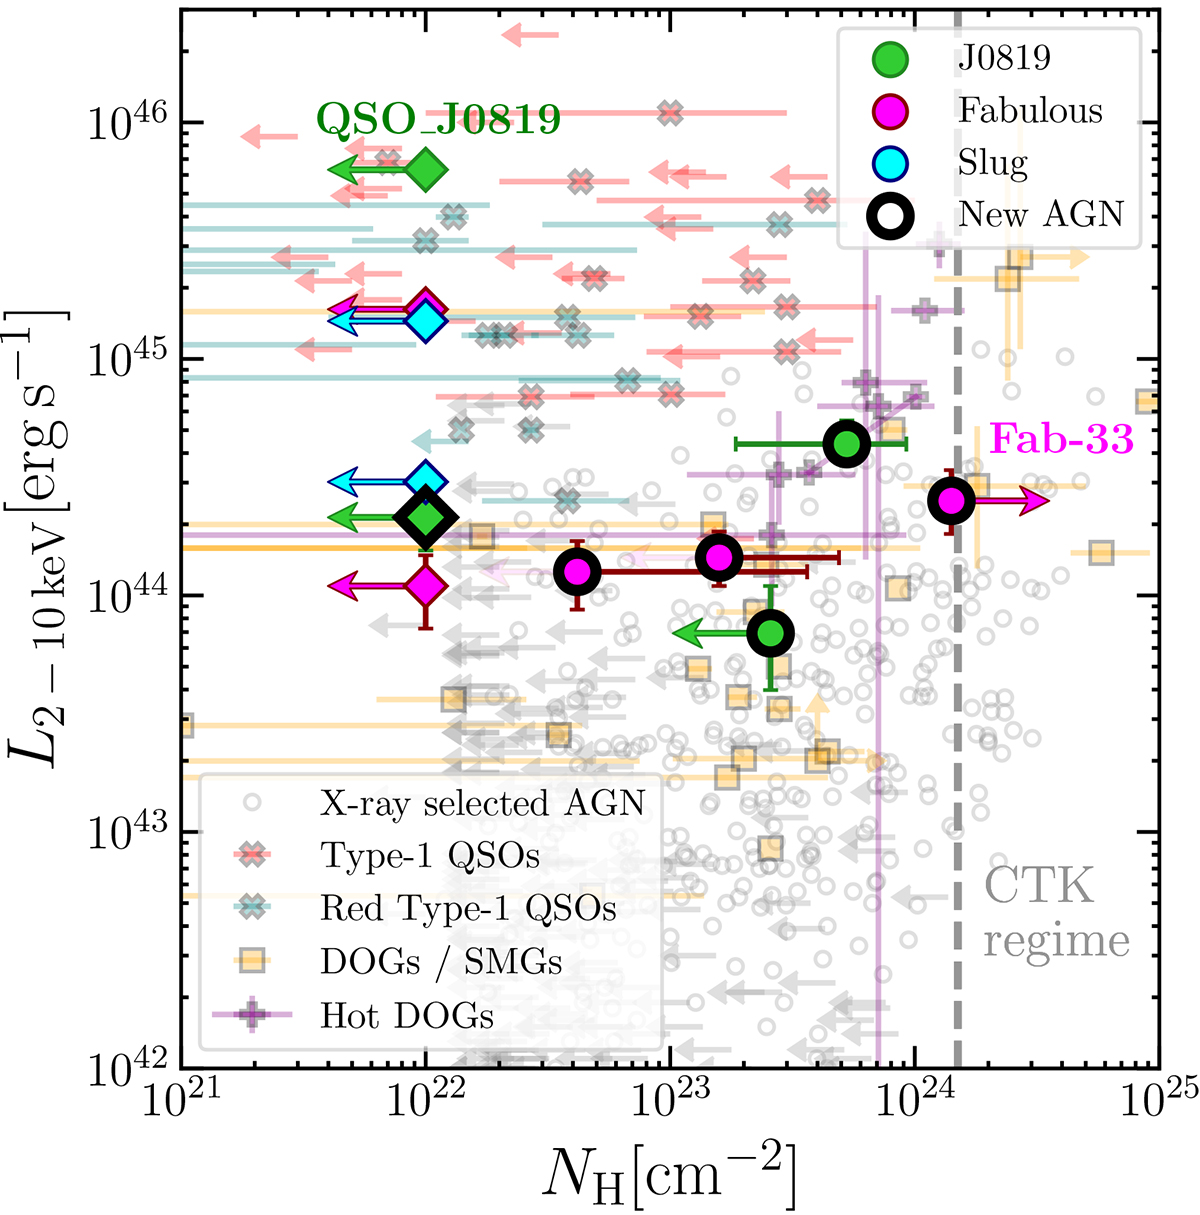
Download original image
Intrinsic 2 − 10 keV luminosity versus column density. Protocluster members are shown in cyan, magenta, and green. Diamonds indicate sources whose properties were derived via spectral fitting, while circles are for sources with properties derived from their hardness ratio (HR). Other classes of AGN detected in the X-ray are shown in different colors (Urrutia et al. 2005; Just et al. 2007; Wang et al. 2013; Banerji et al. 2014; Stern et al. 2014; Assef et al. 2016; Corral et al. 2016; Martocchia et al. 2017; Mountrichas et al. 2017; Ricci et al. 2017; Goulding et al. 2018; Vito et al. 2018a; Zappacosta et al. 2018; Li et al. 2019; Lansbury et al. 2020; Zou et al. 2020). Newly discovered AGN (i.e., not known as such prior to this work) are highlighted with thick black circles.
Current usage metrics show cumulative count of Article Views (full-text article views including HTML views, PDF and ePub downloads, according to the available data) and Abstracts Views on Vision4Press platform.
Data correspond to usage on the plateform after 2015. The current usage metrics is available 48-96 hours after online publication and is updated daily on week days.
Initial download of the metrics may take a while.