Open Access
Fig. A.3.
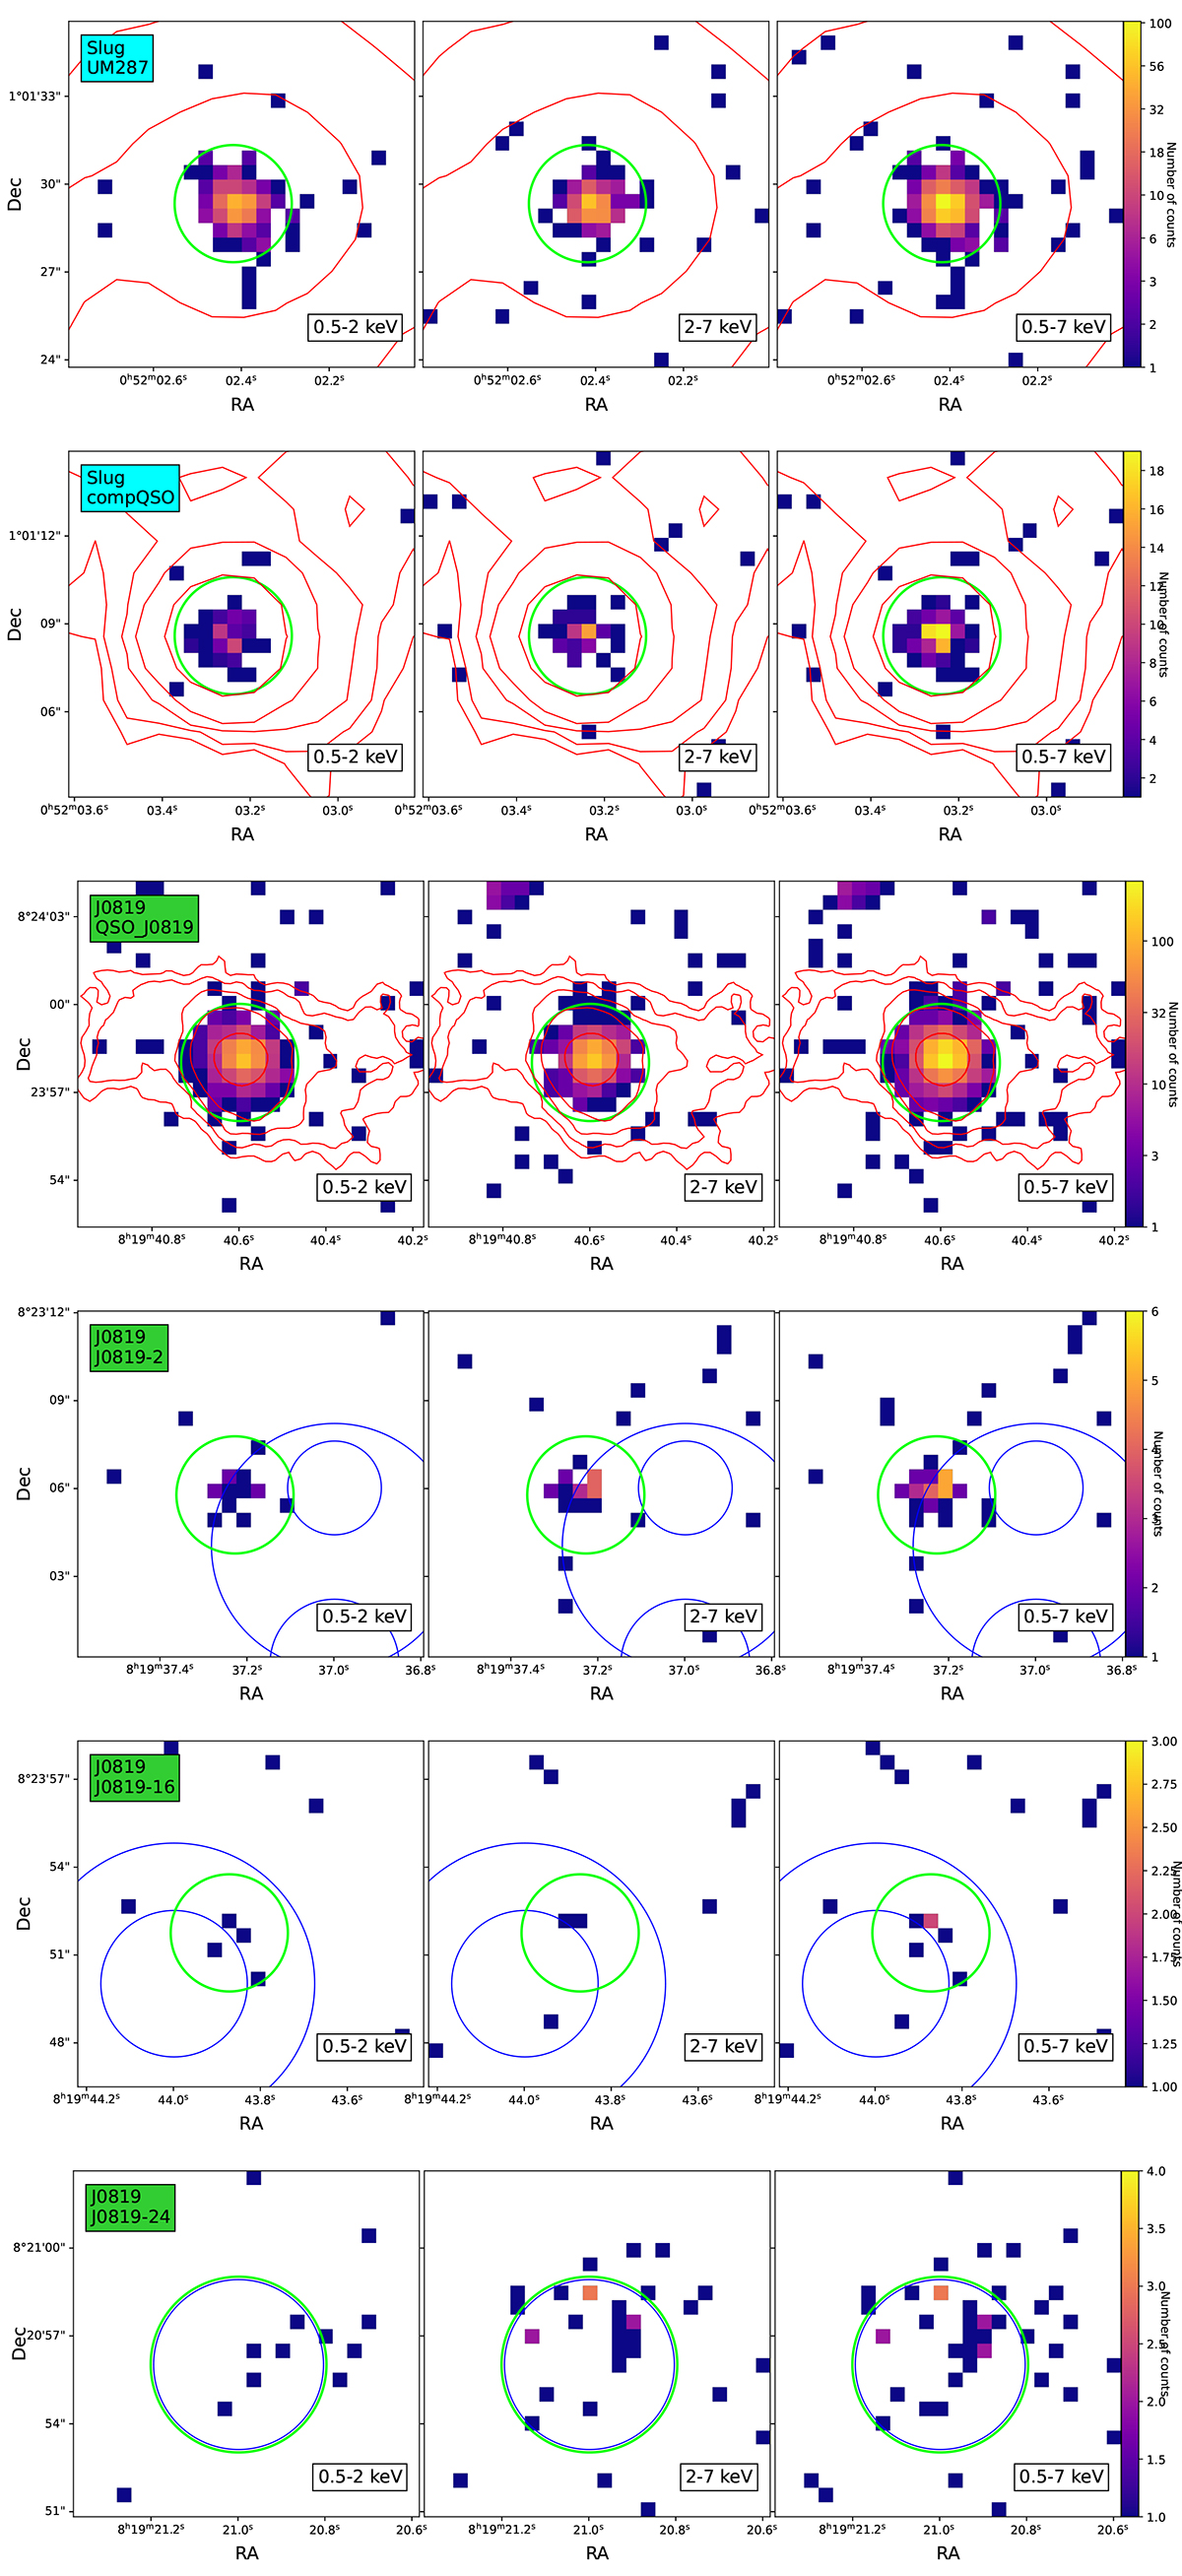
Download original image
Cutouts of the X-ray detected AGN in the three protoclusters, in each band (soft, hard, full). Data are color coded by number of counts, while the green, blue and red contours are the extraction region, the prior position and the Lyα emission of the ELAN.
Current usage metrics show cumulative count of Article Views (full-text article views including HTML views, PDF and ePub downloads, according to the available data) and Abstracts Views on Vision4Press platform.
Data correspond to usage on the plateform after 2015. The current usage metrics is available 48-96 hours after online publication and is updated daily on week days.
Initial download of the metrics may take a while.