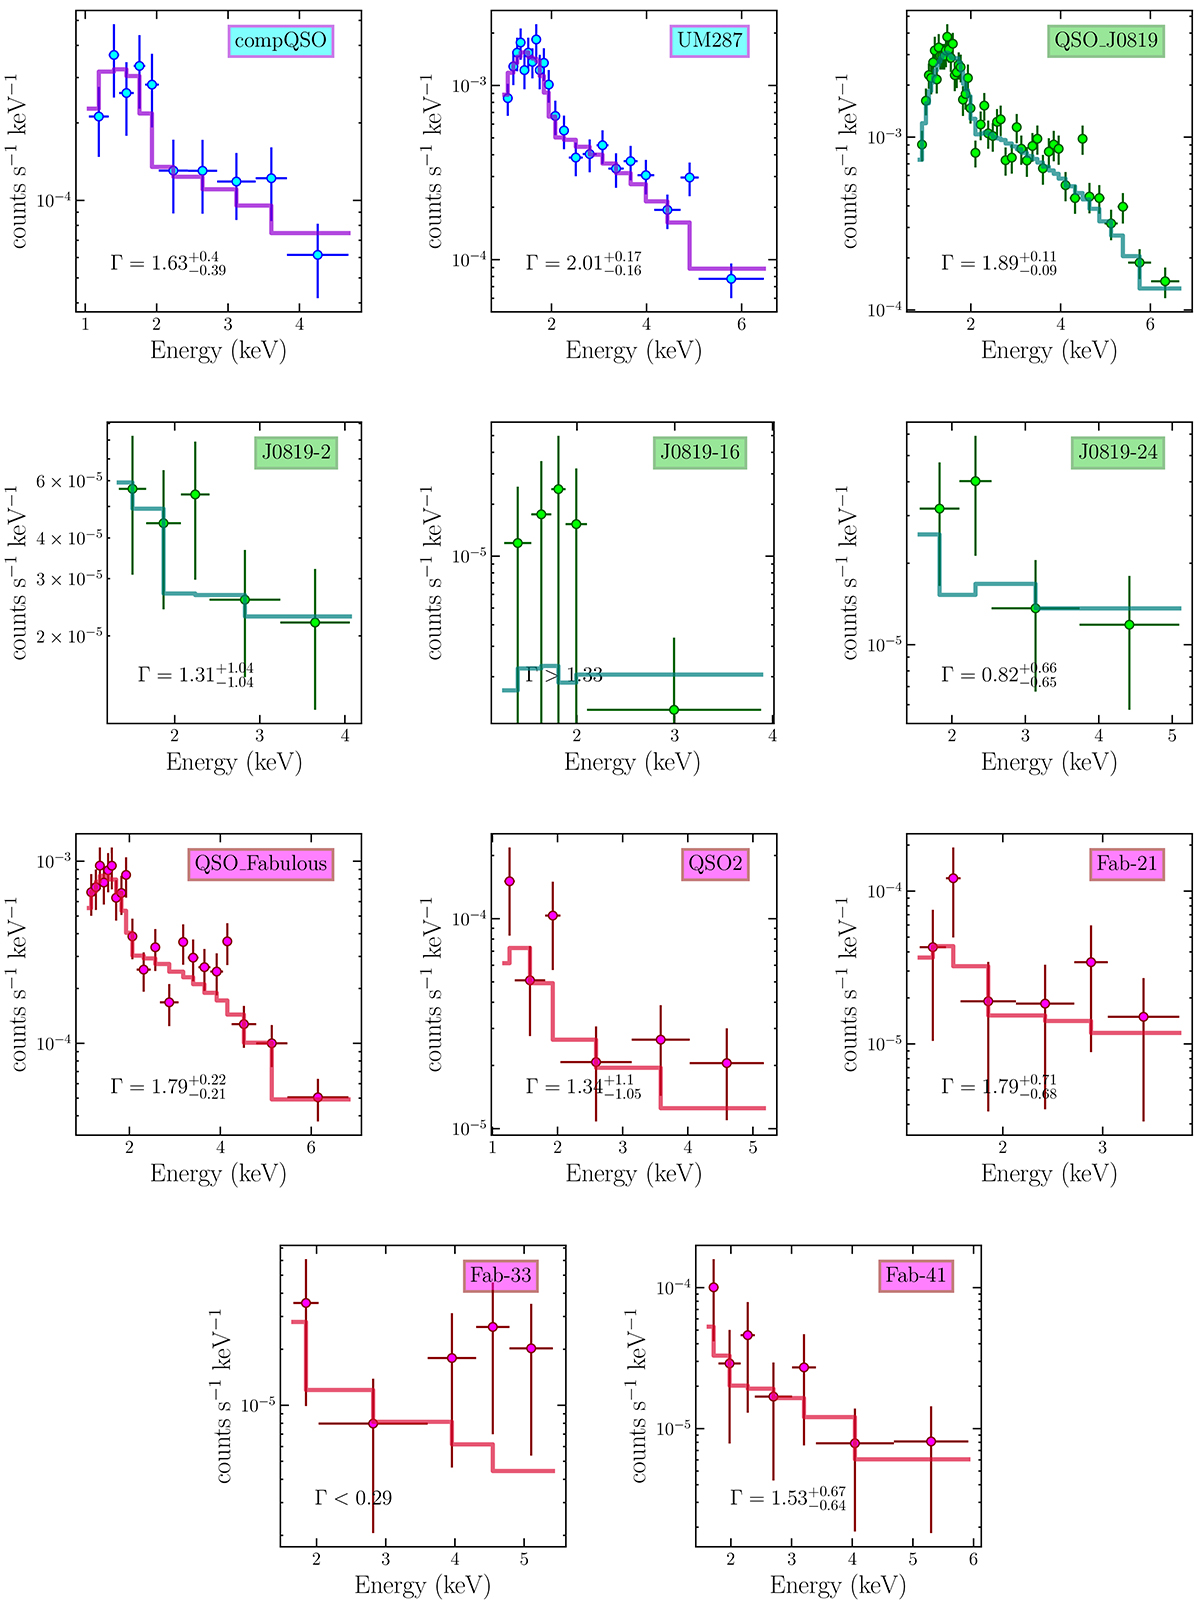
Fig. B.1.
Download original image
X-ray spectra of the AGN detected in the three protocluster. The solid lines are the fit performed using an unabsorbed power law. For sources with more than 30 net counts, the line represents the best fit, while for the other sources (J0819-16, J0819-24, Fab-21, Fab-33, Fab-41) is a power-law with Γ fixed to that found using the HRs.
Current usage metrics show cumulative count of Article Views (full-text article views including HTML views, PDF and ePub downloads, according to the available data) and Abstracts Views on Vision4Press platform.
Data correspond to usage on the plateform after 2015. The current usage metrics is available 48-96 hours after online publication and is updated daily on week days.
Initial download of the metrics may take a while.