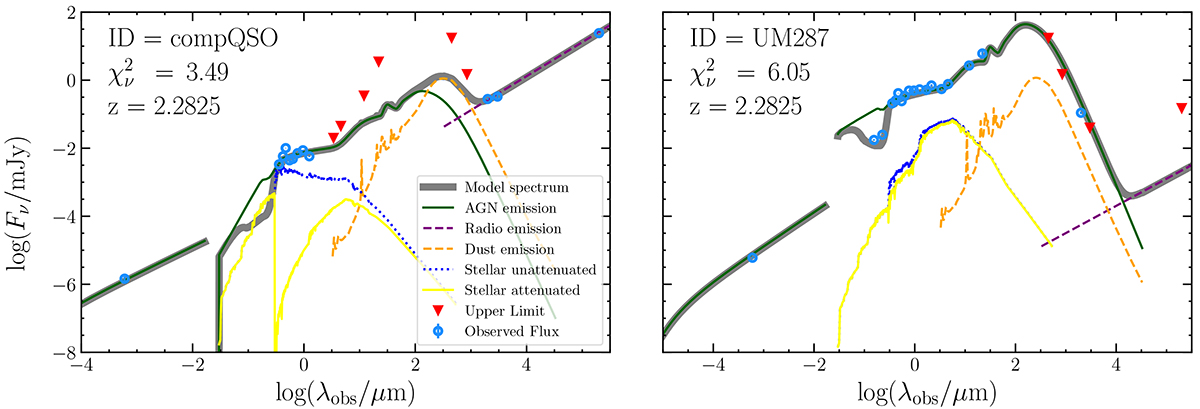
Fig. C.1.
Download original image
Best-fit SEDs of the central QSO (UM287) and companion QSO (CompQSO) in the Slug nebula. The best-fit model is shown in gray, while the individual contribution for each templates are shown in different colors: in green we show the AGN emission; the dust emission is displayed in orange; the stellar unattenuated and attenuated models are the dotted blue and solid yellow lines; the radio emission is highlighted in purple. Points and upper limit are shown as empty light-blue circles and red filled triangles, respectively.
Current usage metrics show cumulative count of Article Views (full-text article views including HTML views, PDF and ePub downloads, according to the available data) and Abstracts Views on Vision4Press platform.
Data correspond to usage on the plateform after 2015. The current usage metrics is available 48-96 hours after online publication and is updated daily on week days.
Initial download of the metrics may take a while.