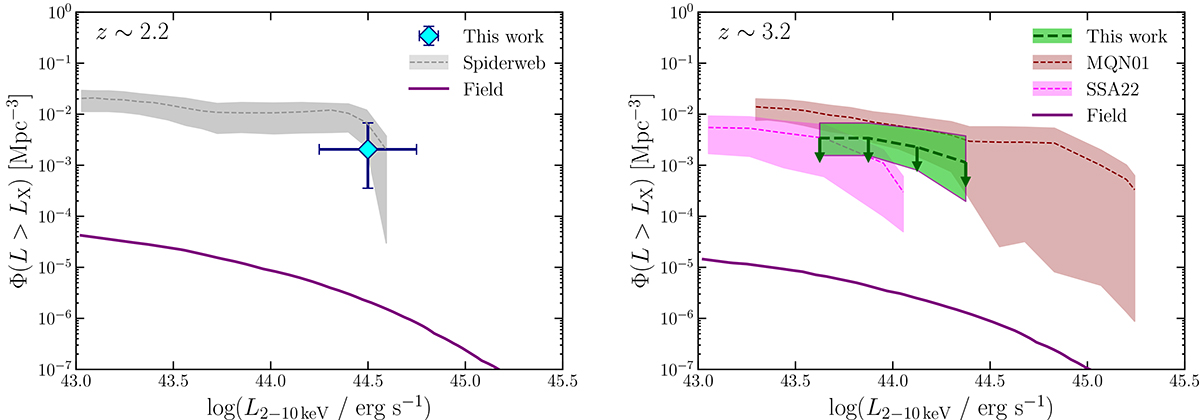
Fig. 5.
Download original image
Cumulative space density in two redshift bins (z ∼ 2.2 and z ∼ 3.2). Our data are shown as a cyan point and a green shaded area, where the uncertainties are computed according to Gehrels (1986). For comparison, the cumulative space densities of other protoclusters at similar redshifts are also reported. The gray shaded region (left panel) represents the cumulative space density for the Spiderweb protocluster (see Tozzi et al. 2022a; Travascio et al. 2025), while the red and pink shaded areas (right panel) correspond to the MQN01 and SSA22 by Travascio et al. (2025). The purple solid line shows the cumulative space density for field AGN from Gilli et al. (2007).
Current usage metrics show cumulative count of Article Views (full-text article views including HTML views, PDF and ePub downloads, according to the available data) and Abstracts Views on Vision4Press platform.
Data correspond to usage on the plateform after 2015. The current usage metrics is available 48-96 hours after online publication and is updated daily on week days.
Initial download of the metrics may take a while.