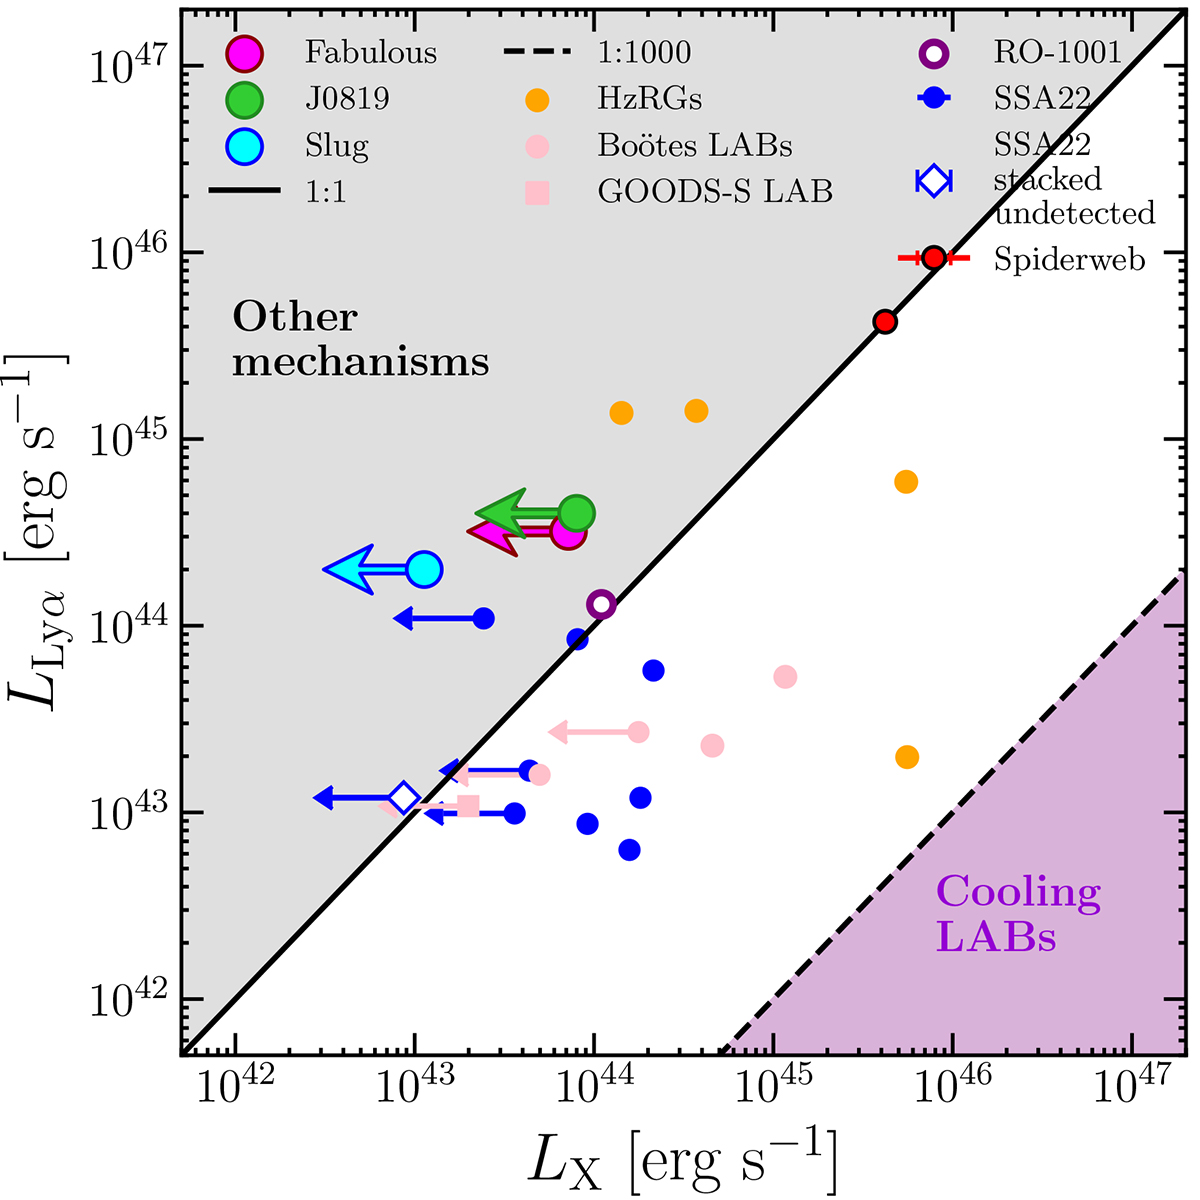
Fig. 7.
Download original image
X-ray vs Lyα luminosity of the extended emission from the ELANe. Magenta, green, and cyan circles represent the Fabulous, J0819, and Slug nebulae, respectively. Blue and white points show SSA22 extended Lyα emission reported by Geach et al. (2009); orange circles represent extended Lyα emission around HzRGs from Reuland et al. (2003); pink circles and squares correspond to extended Lyα emission in the Boötes and GOODS-S fields, respectively (Yang et al. 2009; Nilsson et al. 2006); the red circle marks the Spiderweb extended Lyα nebula fromTozzi et al. (2022b), and the white circle marks the LAB from Daddi et al. (2021). The solid black line represents the 1:1 relation (Geach et al. 2009), while the dashed black line indicates the LX = 1000LLyα relation (Cowie et al. 1980; Bower et al. 2004). The purple region (lower left) corresponds to the scenario in which the main powering channel of the extended Lyα emission is gravitational cooling. The gray area (upper right), represents the region in which the cooling cannot be the fueling mechanism of the nebula.
Current usage metrics show cumulative count of Article Views (full-text article views including HTML views, PDF and ePub downloads, according to the available data) and Abstracts Views on Vision4Press platform.
Data correspond to usage on the plateform after 2015. The current usage metrics is available 48-96 hours after online publication and is updated daily on week days.
Initial download of the metrics may take a while.