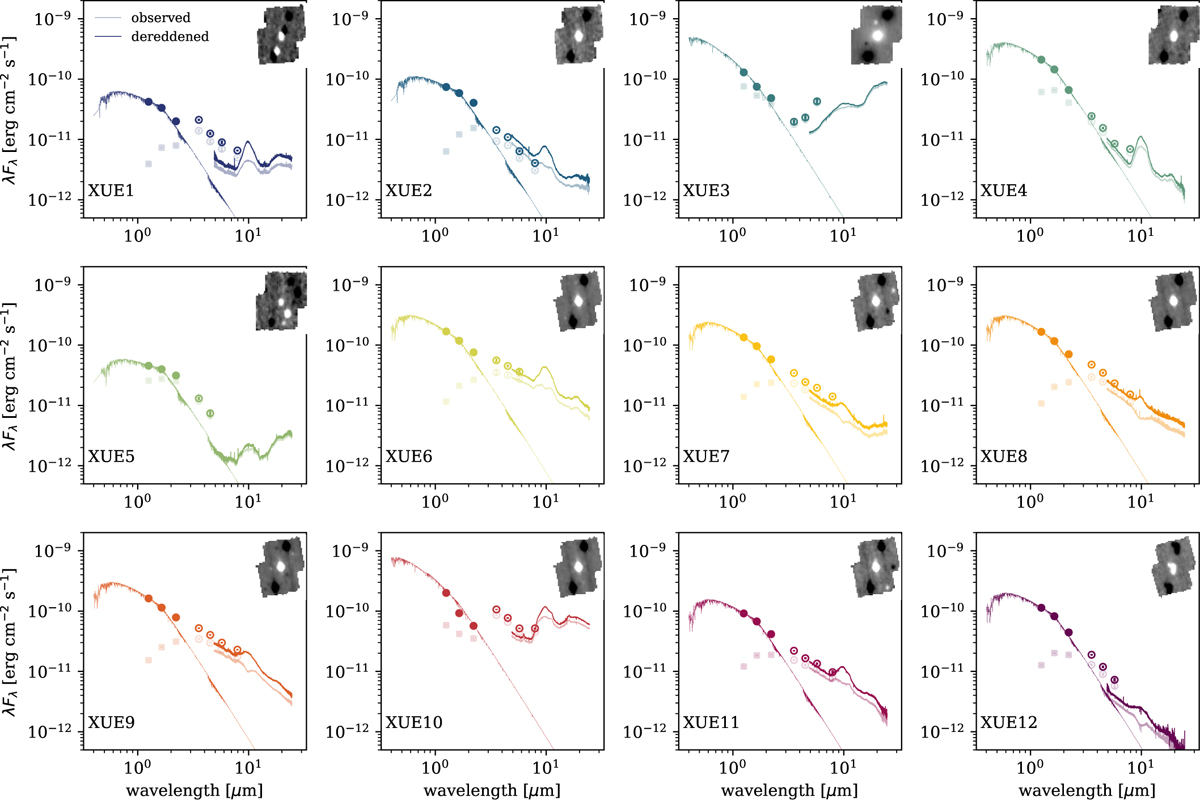
Fig. B.1
Download original image
Spectral energy distributions of the XUE sources. Each column shows the sources in one region: Pis 24, G353.1+0.6 and G353.1+0.7 from left to right. The dashed lines show Phoenix (Brott & Hauschildt 2005) and Kurucz (Kurucz 1993) stellar photospheres with the parameters derived in Section A.2. The dots show UKIRT and IRAC photometry, with the exception of XUE 10 in which VISTA photometry is displayed. The solid line shows the MIRI MRS spectrum. The light colors show the observed data, the dark ones show the dereddened data. The panels in the top-left of each subfigure show the MRS data cube at 5.5 μm.
Current usage metrics show cumulative count of Article Views (full-text article views including HTML views, PDF and ePub downloads, according to the available data) and Abstracts Views on Vision4Press platform.
Data correspond to usage on the plateform after 2015. The current usage metrics is available 48-96 hours after online publication and is updated daily on week days.
Initial download of the metrics may take a while.