| Issue |
A&A
Volume 701, September 2025
|
|
|---|---|---|
| Article Number | A139 | |
| Number of page(s) | 23 | |
| Section | Interstellar and circumstellar matter | |
| DOI | https://doi.org/10.1051/0004-6361/202555456 | |
| Published online | 09 September 2025 | |
XUE: JWST spectroscopy of externally irradiated disks around young intermediate-mass stars★
1
Max-Planck Institut für Astronomie (MPIA),
Königstuhl 17,
69117
Heidelberg,
Germany
2
Department of Astronomy, Stockholm University, AlbaNova University Center,
10691
Stockholm,
Sweden
3
Department of Astronomy & Astrophysics, Pennsylvania State University,
525 Davey Laboratory,
University Park,
PA
16802,
USA
4
Department of Astrophysics/IMAPP, Radboud University,
PO Box 9010,
6500
GL
Nijmegen,
The Netherlands
5
Center for Exoplanets and Habitable Worlds, Pennsylvania State University,
525 Davey Laboratory,
University Park,
PA
16802,
USA
6
Universitäts-Sternwarte München, Ludwig-Maximilians-Universität,
Scheinerstr. 1,
81679
München,
Germany
7
FACom, Instituto de Física – FCEN, Universidad de Antioquia,
Calle 70 No. 52-21,
Medellín,
Colombia
8
Astronomy Unit, School of Physics and Astronomy, Queen Mary University of London,
London
E1 4NS,
UK
9
Observatorio Astronómico Nacional, Universidad Nacional de Colombia,
Bogotá,
Colombia
10
Centre for Astrophysics Research, University of Hertfordshire,
Hatfield,
AL10 9AB,
UK
11
Alma Mater Studiorum, Università di Bologna, Dipartimento di Fisica e Astronomia (DIFA),
Via Gobetti 93/2,
40129
Bologna,
Italy
12
INAF-Osservatorio Astrofisico di Arcetri,
Largo E. Fermi 5,
50125
Firenze,
Italy
13
Gemini Observatory/NSFs NOIRLab,
950 N. Cherry Ave.,
Tucson,
AZ
85719,
USA
14
AURA for the European Space Agency (ESA), ESA Office, Space Telescope Science Institute,
3700 San Martin Drive,
Baltimore,
MD
21218,
USA
★★ Corresponding author.
Received:
9
May
2025
Accepted:
18
July
2025
Abstract
Context. Our knowledge of the initial conditions of terrestrial planet formation is mainly based on the study of protoplanetary disks around nearby isolated low-mass stars. However, most young stars and therefore planetary systems form in high-mass star-forming regions and are exposed to ultraviolet radiation, affecting the protoplanetary disk. These regions are located at large distances and only now with JWST has it become accessible to study the inner disks surrounding young stars.
Aims. We present the eXtreme UV Environments (XUE) program, which provides the first detailed characterization of the physical and chemical properties of the inner disks around young intermediate-mass (1–4 M⊙) stars exposed to external irradiation from nearby massive stars. We present high-signal-to-noise MIRI-MRS spectroscopy of 12 disks located in three subclusters of the high-mass star-forming region NGC 6357 (d ~ 1690 pc).
Methods. Based on their mid-infrared spectral energy distribution, we classified the XUE sources into Group I and II based on the Meeus scheme. We analyzed their molecular emission features, and compared their spectral indices and 10 μm silicate emission profiles to the ones of nearby Herbig and intermediate T Tauri (IMTT) disks.
Results. The XUE program provides the first detailed characterization of the rich molecular inventory in IMTT disks, including water, CO, CO2, HCN, and C2H2. In the XUE sample, the detected emission likely originates from within 10 au, although this inner disk origin may not be typical for all externally irradiated disks. Despite being more massive, the XUE stars host disks with a molecular richness comparable to isolated T Tauri systems. The spectral indices are also consistent with similar-mass stars in nearby regions. The 10 μm silicate features in the XUE sample exhibit lower F11.3/F9.8 ratios at a given Fpeak, suggesting that the disk surfaces may be dominated by smaller grains compared to nearby disks. However, uncertainties in extinction prevent us from drawing firm conclusions about their inner disk properties. The majority of disks display water emission from the inner disk, suggesting that even in these extreme environments rocky planets can form in the presence of water. Only one object shows PAH emission, contrasting with the higher PAH detection rates in IMTT surveys from lower-UV environments.
Conclusions. The absence of strong line fluxes and other irradiation signatures suggests that the XUE disks have been truncated by external UV photons. However, this truncation does not appear to significantly impact the chemical richness of their inner regions. These findings indicate that even in extreme environments, IMTT disks can retain the ingredients necessary for rocky planet formation, comparable to the ones of lower-mass T Tauri disks in low-mass star-forming regions.
Key words: planets and satellites: formation / protoplanetary disks / stars: pre-main sequence / infrared: ISM / infrared: stars
The data described here may be obtained from doi:10.17909/tkjy-f210
© The Authors 2025
 Open Access article, published by EDP Sciences, under the terms of the Creative Commons Attribution License (https://creativecommons.org/licenses/by/4.0), which permits unrestricted use, distribution, and reproduction in any medium, provided the original work is properly cited.
This article is published in open access under the Subscribe to Open model.
Open Access funding provided by Max Planck Society.
1 Introduction
Planets form in circumstellar disks around pre-main-sequence (PMS) stars, which are broadly classified into T Tauri stars (typically of spectral type F or later; Joy 1945; Appenzeller & Mundt 1989), and Herbig Ae/Be (HAeBe) stars (spectral type A or B; Herbig 1960; Johnson et al. 2010; Brittain et al. 2023; Stapper et al. 2025a). Intermediate-mass T Tauri stars (IMTTs) are considered the evolutionary predecessors of Herbig Ae/Be stars. With masses exceeding 1–5 M⊙, IMTTs are at an earlier evolutionary stage and have lower effective temperatures than HAeBe stars, typically exhibiting spectral types from early K to late F (Calvet et al. 2004; Valegård et al. 2021).
Spitzer mid-infrared (MIR) and ground-based near-infrared (NIR) spectroscopic observations of T Tauri disks located in nearby regions such as Lupus and Taurus have revealed a rich molecular inventory in their inner 10 AU (e.g., Carr & Najita 2008; Salyk et al. 2008; Pascucci et al. 2009, 2013; Pontoppidan et al. 2010; Mandell et al. 2012), enabling molecules such as CO, H2O, OH, C2H2, HCN, and 12CO2 to be detected. The improved sensitivity of the James Webb Space Telescope (JWST; Rigby et al. 2023) has enabled the detection of more and more complex molecules. Observations with the Medium Resolution Spectrometer (MRS; Wells et al. 2015) of the Mid-InfraRed Instrument (MIRI; Wright et al. 2015; Rieke et al. 2015; Wright et al. 2023) have revealed molecules such as water, CO, 12CO2 isotopologs, and several hydrocarbons (e.g., Kóspál et al. 2023; Grant et al. 2023; Gasman et al. 2023; Romero-Mirza et al. 2024; Vlasblom et al. 2025; Salyk et al. 2025; Frediani et al. 2025). Interestingly, disks surrounding very low-mass stars (<0.3 M⊙) appear to be carbon-rich and show a deficiency in O-rich species (e.g., Tabone et al. 2023; Arabhavi et al. 2024). In contrast, Spitzer observations of Herbig disks in nearby star-forming regions suggest that they are relatively line-poor at IR wavelengths (e.g., Pontoppidan et al. 2010; Salyk et al. 2011; Brittain et al. 2023), which Antonellini et al. (2016) attribute to the high continuum flux levels. MIRI observations of nearby IMTT disks are very challenging because of their brightness. Therefore, little is known about the inner disk molecular inventory of these objects.
With the advent of JWST, it is now possible to target protoplanetary disks (PPDs) in massive star-forming regions, typically located at large distances (d > 1.5 kpc; Feigelson et al. 2013). JWST’s improved sensitivity and spectral resolution allows us to detect spectral lines on top of a bright continuum. The large distances of these regions enable us to observe PPDs around intermediate-mass young stars, which would otherwise be too bright and saturate in nearby star-forming regions when observed with JWST.
More than half of all stars, and thus planets, form under high external irradiation (≈103–6 G0, where G0 is the Habing field; Winter & Haworth 2022). These FUV fields are several orders of magnitude higher than the ones of nearby, low-mass star-forming regions such as the well-studied Taurus or Ophiuchus clouds. Therefore, characterizing PPDs in these extreme radiation environments is crucial to understanding the diversity of the detected exoplanet population (Winter et al. 2020; Qiao et al. 2023; Allen et al. 2025). ALMA studies show that the cold dust reservoir in the outer disks near massive stars in Orion is depleted by photo-evaporation (Ansdell et al. 2017; van Terwisga et al. 2019, 2020). In contrast, inner disk studies of a large sample of young massive star clusters, combining X-ray (Chandra) and near-infrared (Spitzer) data, have obtained contradictory conclusions about the impact of cluster environment on the dissipation timescale of the warm inner disk (Roccatagliata et al. 2011; Fang et al. 2012; Richert et al. 2015, 2018; Guarcello et al. 2023. Theoretical studies demonstrate the impact of cluster membership and UV irradiation on disk properties (Fatuzzo & Adams 2008; Winter et al. 2020). For instance, dynamical processes and photo-evaporative loss may result in disk truncation, leading to different planetary system architectures lacking gas giants in wide orbits. Additionally, external FUV flux can heat surface layers of the disk up to several tens of astronomical units, increasing the emitting area and therefore boosting the observed line fluxes for species like, OH, C2H2, and water (Antonellini et al. 2015, Hernandez Arboleda, in prep.).
JWST observations of externally irradiated disks around low-mass stars in the Orion Nebular Cluster (ONC) show the effect of the far-ultraviolet (FUV) radiation on the disk chemistry. For example, Berné et al. (2023) present the first detection of ![Mathematical equation: $\[\mathrm{CH}_{3}^{+}\]$](/articles/aa/full_html/2025/09/aa55456-25/aa55456-25-eq1.png) in the photodissociation region of the ionized proto-planetary disk (so called proplyd) d203-506, showing that photochemistry may allow for different pathways to complex organic chemistry. OH observations of the same source show evidence of photodissociation of H2O in the presence of FUV radiation (Zannese et al. 2023). Observations of CH+and
in the photodissociation region of the ionized proto-planetary disk (so called proplyd) d203-506, showing that photochemistry may allow for different pathways to complex organic chemistry. OH observations of the same source show evidence of photodissociation of H2O in the presence of FUV radiation (Zannese et al. 2023). Observations of CH+and ![Mathematical equation: $\[\mathrm{CH}_{3}^{+}\]$](/articles/aa/full_html/2025/09/aa55456-25/aa55456-25-eq2.png) emission (Zannese et al. 2025) as well as the detection of CI fluorescence tracing the irradiated outer disk and photo-evaporative wind (Aru et al. 2024) provide additional evidence of FUV-pumping (Goicoechea et al. 2024).
emission (Zannese et al. 2025) as well as the detection of CI fluorescence tracing the irradiated outer disk and photo-evaporative wind (Aru et al. 2024) provide additional evidence of FUV-pumping (Goicoechea et al. 2024).
In the ONC, where a single O star (θ1 Ori C) dominates the UV flux, irradiated disks are expected to migrate in and out of the proplyd regime (~5 × 10⁴ G0) on short timescales (~0.1 Myr). In contrast, high-mass star-forming regions are usually powered by numerous O-type stars (e.g., Feigelson et al. 2013), exposing PPDs to consistently higher radiation fields (103−106 G0) throughout their lifetimes. To investigate the impact of such extreme environments, we propose the eXtreme UV Environments (XUE) program, which aims to characterize the physical and chemical properties of highly irradiated PPDs in NGC 6357.
Having an estimated age of 1–1.6 Myr (Getman et al. 2014b) and being located at a distance of 1.69 kpc (Ramírez-Tannus et al. 2023), NGC 6357 is among the youngest and nearest massive star-forming regions. It hosts one of the most massive stars in the Galaxy (Pis24-1, O4III(f+)+O3.5If*; Walborn 2003) along with more than 20 additional O-type stars scattered across the field (Figure 1). NGC 6357’s three subclusters – Pismis 24, G353.1+0.6, and G353.2+0.7 (Churchwell et al. 2007; Fang et al. 2012; Getman et al. 2014b) – share a similar age and distance but exhibit considerable variation in the FUV radiation fields that influence their PPDs (Russeil et al. 2010; Ramírez-Tannus et al. 2020), offering us the opportunity to study in detail the impact of diverse radiation environments on the early evolution of disks.
In this paper we present the XUE sample. Section 2 describes the sample selection, the ancillary data used to characterize the stellar properties, and the JWST MIRI observations and data reduction. In Sections 3 and 4 we describe the spectral energy distributions (SEDs) and the molecular content of our sources. Section 5 compares the XUE sources with nearby isolated T Tauri, IMTT and Herbig disks as well as with a sample of PPDs in Orion. Finally, in Sections 6 and 7 we discuss and conclude our work.
2 Observations
In this section we introduce the XUE sample in terms of selection criteria, observations, data reduction, and the auxiliary photometry used for our analysis. A detailed description of the Gaia and photometric properties of our sample is given in Appendix A.
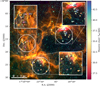 |
Fig. 1 Color composite image of the massive star-forming region NGC 6357 combining UKIRT Ks-band (blue) with Spitzer-IRAC 4.5 μm (green) and Spitzer-IRAC 8.0 μm (red) data. The small colored points show the location of the XUE sources with respect to the massive stars (Teff > 25 000 K) in the region which are shown with the stars. The color bar indicates the temperature of the massive stars. The white circles show the location of the three subclusters: Pis 24 containing XUE 1, 2, 3, and 4, G353.1+0.6 containing XUE 5, 6, 7, and 8, and G353.1+0.7 containing XUE 9, 10, 11, and 12. |
2.1 Sample selection
In order to control for age and FUV flux history we selected disks in three subregions in NGC 6357 where the FUV flux regime differs, but formed in the same molecular cloud and environment (see Figure 1). We selected PPDs surrounding stars from the study of Ramírez-Tannus et al. (2020) which selected cluster members from the MYStIX catalog (Townsley et al. 2018; Feigelson et al. 2013). The selection included sources which had spectral type determinations based on NIR spectra obtained with the K-band Multi Object Spectrograph (KMOS; Sharples et al. 2013) on the ESO Very Large Telescope (VLT) as well as signatures of mid-infrared excess based on their Spitzer photometry. From all the objects that met the previous two criteria, we selected sources with SEDs that are characteristic of Class II PMS stars; namely, disk-bearing stars. We aimed to cover a range of spectral types (and thus masses) from G to A evenly distributed between the subregions, as close as possible to the massive stars.
To calculate the external FUV flux toward the XUE sources, we integrated Phoenix atmosphere models (Husser et al. 2013) over the wavelength range 912–2000 Å to obtain the FUV luminosity from the massive stars. The FUV flux exposure to the XUE sources was computed based on the projected distance to the massive stars, assuming no extinction between the massive stars and our sources. For the input parameters to the Phoenix models, we selected the MIST (MESA Isochrones and Stellar Tracks Dotter 2016) isochrones that matched the effective temperature and luminosity of each OB star (from Ramírez-Tannus et al. 2020; Maíz Apellániz et al. 2007), assuming that the rotational velocity of the star is given by v = 0.4 vcrit, where vcrit is the critical rotational velocity of the star. The assumed properties for the massive stars are listed in Table A.1. The FUV luminosities obtained using this method agree within 10% with those computed using the scaling formula between stellar mass and FUV luminosity from Parravano et al. (2003). Figure 2 shows the external FUV flux for each of the XUE sources as a function of the projected distance to the two massive stars that contribute the most to their irradiation. Due to their location near several massive stars in NGC 6357, we expect the XUE sources to have been constantly exposed to a high radiation field throughout their lifetime.
The final selection contained 15 disks, 5 per subregion, in order to have a wide spread of stellar mass and external FUV irradiation. Out of those 15 disks, one observation failed and two turned out to be foreground stars, leaving us with a final sample of 12 sources. The final sample of 12 sources contains 4 disks per subregions and spans a range of external FUV fluxes from ~103 to 106 G0 (Figure 2). Two of our sources are late-A or early-F type stars (XUE 3 and XUE 10), two are K-type stars (XUE 2 and XUE 5), and the remaining systems are G-type stars (Table A.2). In Section 2.3 and Appendix A we present the mass estimates for our sources and show that, with the exception of the T Tauri disk XUE 1, they are IMTT disks.
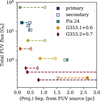 |
Fig. 2 FUV flux experienced by our targets with respect to their projected separation to ionizing sources in each NGC 6357 subregion. The full and empty symbols show the primary and secondary ionizing stars in each subregion. The names of the sources are displayed on the markers and are visible when zooming in. |
2.2 JWST MIRI spectra
The observations were taken as part of the XUE project in Cycle 1 (GO-1759; Ramirez-Tannus et al. 2021) with the Mid-Infrared Instrument in the MIRI-MRS (Rieke et al. 2015; Wells et al. 2015; Wright et al. 2015). All three wavelength settings (SHORT, MEDIUM and LONG) were used for the observations. A four-point dither optimized for a point source was performed in the negative direction. The observations were obtained in the FASTR1 readout mode with 40 groups per integration and two integration per dither position. No separate background observations were taken for these observations as the background in these regions is highly spatially variable and therefore would not be representative of the background around our sources.
The data were reduced using the JWST pipeline version: 1.14.0 (Bushouse et al. 2024). The Detector1 part of the pipeline was run without modifications. In Spec2 we implemented a custom background subtraction; after the WCS assignment, we performed a background subtraction by removing the two nodding positions from each other. This minimizes the effect of the variable background in comparison to taking a dedicated background observation. We then run the standard steps in Spec2, including the residual fringe correction. The Spec3 run without any modifications. To extract the spectra, we measured the position of each source in the datacube and ran the extract1d step with the position of the sources as input.
We then stitched the 1D spectra by keeping the short wavelength ends of each band and, if necessary, scaling the flux of each band to match that of the previous one. Given the very strong nebular and emission from Polycyclic aromatic hydrocarbons (PAHs) from the surroundings, the resulting 1D spectra still have residuals from the background subtraction. To mitigate the effect of the over- or under-subtraction of nebular lines, we used a peak removal algorithm that finds all local maxima by a simple comparison of neighboring values. These maxima were then replaced with the mean value of the neighboring pixels.
2.3 Auxiliary data
In addition to the MIRI-MRS spectra we used photometric data, taken from the MYStIX catalog (Feigelson et al. 2013; King et al. 2013; Kuhn et al. 2013) which includes the J H K-band magnitudes from the United Kingdom Infra-red Telescope (UKIRT) wide field camera (Lawrence et al. 2007; Lucas et al. 2008), plus the four Spitzer IRAC bands (GLIMPSE; Benjamin et al. 2003). In the specific case of XUE 10, we used VVV NIR photometry for the J, H, and K-bands.
In Appendix A we derive the best mass estimates for the XUE sources. The inferred stellar masses for most XUE stars fall within (2–4) M⊙, classifying them as intermediate-mass young stars. This aligns with their initial Ks-band selection criteria (MK < 10 mag) for JWST observations (Figure A.2d; Ramírez-Tannus et al. 2020). The exception is XUE 1, a binary system, whose primary component has a mass of ~1 M⊙ (Ramírez-Tannus et al. 2023). Based on the observed photometry and MIRI spectroscopy of the XUE sources we construct the SEDs between 1 and 28 μm which are shown in Appendix B.
3 MIRI-MRS spectral energy distributions
The observed MIR SEDs between 4.8 and 25 μm are shown with the lighter colors in Figure 3. To deredden our data, we adopt the Gordon et al. (2023) extinction law (Gordon et al. 2009; Fitzpatrick et al. 2019; Gordon et al. 2021; Decleir et al. 2022), RV = 3.3, and the AV values derived in Section A.3. The dereddened SEDs are shown with the darker colors in Figure 3. The panels at the top left of each SED show a slice of the MRS data cubes at 5.5 μm. In the cases of XUE 1, 3, 5, 7, and 12 it is possible to see that there are extra sources in the detector with separations of at most 2″. The extra sources are probably contaminating the IRAC photometric points, and therefore care must be taken when interpreting the existing MIR photometry for these targets (e.g., Figure B.1). The spectra presented in this paper correspond to the sources at the center of each cube. The additional sources detected in the field are either foreground stars or background dust; as such, their analysis falls outside the scope of this paper.
We classify our sources based on their MIRI-MRS spectral shape in Group I and II following Meeus et al. (2001) classification. Group I disks show a strong mid- and far-infrared excess in their SEDs, indicating that a significant portion of the disk surface is directly illuminated by the central star. These disks are thought to be geometrically flared, meaning that the outer disk regions receive and reprocess stellar radiation efficiently and therefore, their SEDs are brighter toward redder wavelengths. Imaging of Group I disks showed that their SEDs can be understood as a result of large disk gaps, and/or the presence of an inner hole (e.g., Maaskant et al. 2014; Garufi et al. 2017). Group II disks exhibit a weaker mid- to far-IR excess compared to Group I. The SED declines steeply beyond the NIR range, suggesting that the outer disk is receiving less direct stellar radiation. The disk structure is considered to be self-shadowed, meaning that a puffed-up inner disk rim blocks stellar light from reaching the outer disk or that the disk has a small outer dust radius. These disks are often more compact and show weaker mid- to far-IR emission (Meeus et al. 2001; Valegård et al. 2021).
The SEDs of XUE 2, 4, 6, 7, 8, 9, 11, and 12 resemble those of Group II disks. The SEDs of XUE 1, 3, 5, and 10 resemble Group I disks. XUE 1 and 10 are consistent with either flaring disks or disks with a gap (Portilla-Revelo et al. 2025); however, given the available data, it is challenging to distinguish between these two scenarios. XUE 3 and 5 exhibit rising spectra, suggesting the presence of a substantial amount of cold dust. Specifically, the infrared excess of XUE 5 begins at approximately 8 μm, which is indicative of an inner hole. A similar interpretation may apply to XUE 3; however, due to the limitations of the current data, this remains uncertain. Following Meeus et al. (2001) all our disks belong either to Group Ia or to Group IIa given the ubiquitous presence of the 10-μm silicate feature in the XUE sample.
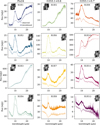 |
Fig. 3 Spectral energy distributions of the XUE sources. Each column shows the sources in one region: Pis 24, G353.1+0.6, and G353.1+0.7 from left to right. The light colors show the observed data; the dark ones show the dereddened data. The panels in the top of each subfigure show the MRS data cube at 5.5 μm. |
Presence of molecular emission in the spectra.
4 Molecular inventory
The XUE sample presents a great diversity in their molecular content. Figures 4, C.1, C.2, C.3, and C.4 show an overview of continuum subtracted spectral regions containing key molecules. To estimate the continuum of our MIRI observations we used the ctool package (Pontoppidan et al. 2024). Table 1 summarizes the molecular content of all the sources in our sample, and a detailed description of each source is presented in Appendix D.
We detect C- and O- bearing molecules such as CO, HCN, C2H2, OH, and 12CO2, which have also been detected in samples of nearby T Tauri disks (e.g., Kóspál et al. 2023; Henning et al. 2024; Banzatti et al. 2023). We also look for signatures of hot (~900 K), warm (~400 K), and cold (~200 K) water using the temperature-dependent flux ratio between the two low-energy lines near 23.85 μm (see Temmink et al. 2024; Banzatti et al. 2025, Figure C.4). Most of our sources have a hot H2O component, while only three show signatures of warm H2O and none show a cold H2O component. In one case (XUE 10) we detect multiple 12CO2 isotopologs as 13CO2, 16OC18O, and 16OC17O (Frediani et al. 2025), which have been detected in two nearby T Tauri stars (Vlasblom et al. 2025; Salyk et al. 2025). In the following we discuss the molecular content in the context of the classification presented in Section 3.
XUE 3 and 5, which are the sources classified as Group I and with SEDs consistent with having an inner hole, do not show any molecular emission. The other Group I sources are XUE 1 and 10. XUE 1 is a 1 M⊙ star and has a rich molecular inventory, similar to nearby T Tauri disks as presented in Ramírez-Tannus et al. (2023). In this work we were able to identify OH which was not reported in Ramírez-Tannus et al. (2023), this is thanks to the improvement in the data reduction with respect to previous versions of the JWST pipeline. A characterization of the thermochemical structure of XUE 1 is presented in Portilla-Revelo et al. (2025). XUE 10 is a Herbig star with a very peculiar molecular content. It presents extremely abundant 12CO2, 13CO2, 16OC18O, and 16OC17O and it is very poor in water. A detailed investigation this source XUE 10 is presented in Frediani et al. (2025).
Among the eight Group II sources, half (XUE 6, 7, 8, and 12) show a rich molecular inventory including CO, warm water, HCN, C2H2, and 12CO2. XUE 8 is remarkable due to its very abundant water content. In XUE 8 and 12 we also detect the presence of warm (~400 K) water lines between 23 and 24 μm (e.g., Gasman et al. 2025; Banzatti et al. 2025). XUE 4 does not exhibit any molecular emission in the MIRI wavelength range. Compared to other Group II sources, XUE 4 also lacks significant IR excess in the 2–7 μm region (Figure B.1). As with XUE 3 and XUE 5, the absence of molecular emission could point to a gas-depleted inner disk. However, the substantial IR excess at most MIRI wavelengths and the prominent 10 μm silicate feature indicate that dust is still present, suggesting that XUE 4 may host a dust-rich but gas-poor inner disk. XUE 9 does not show any molecular emission, except for a tentative detection of warm water; nevertheless, this source does have IR excess starting at around 2 μm. Therefore, the lack of molecules in XUE 9 cannot be attributed to a gas depleted inner disk and needs to be investigated further. XUE 2 and 11 are also poor in molecular content, where the spectrum of XUE 11 only contains warm water and HCN and XUE 2 only has a definite detection of CO, and tentative detections of warm water, HCN, OH, and 12CO2. The spectrum of XUE 2 has an emission feature at 7.15 μm which could be consistent with the detection of the methyl cation (![Mathematical equation: $\[\mathrm{CH}_{3}^{+}\]$](/articles/aa/full_html/2025/09/aa55456-25/aa55456-25-eq4.png) ) as reported by Berné et al. (2023) and later detected in TW Hya (Henning et al. 2024). Nevertheless, given the possible presence of water emission at those same wavelengths and the S/N of our observations, it is not possible to claim a strong detection of
) as reported by Berné et al. (2023) and later detected in TW Hya (Henning et al. 2024). Nevertheless, given the possible presence of water emission at those same wavelengths and the S/N of our observations, it is not possible to claim a strong detection of ![Mathematical equation: $\[\mathrm{CH}_{3}^{+}\]$](/articles/aa/full_html/2025/09/aa55456-25/aa55456-25-eq5.png) in XUE 2 (see Lemus-Nemocón, in prep.). XUE 2 and 11 show relatively low 7 μm excess, which could explain the poor molecular inventory.
in XUE 2 (see Lemus-Nemocón, in prep.). XUE 2 and 11 show relatively low 7 μm excess, which could explain the poor molecular inventory.
Within the XUE sample only XUE 10 presents PAH emission at 6.2 and 11.3 μm. This is unexpected, as the central masses of our sources and the surrounding FUV flux suggest that PAHs inherited from the ISM should be excited in these disks (see Section 6.3).
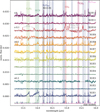 |
Fig. 4 Overview of the spectral region between 13.2 and 16 μm for all XUE sources. The lowermost spectrum shows the most prominent molecules in this region: HCN at 400 K and 1016 cm−2 (dark green), H2O at 400 K and 2.2 × 1016 cm−2 (magenta), C2H2 at 400 K and 2.2 × 1016 cm−2 (light green), CO2 at 400 K and 1016 cm−2 (red), H2O at 850 K and 1018 cm−2 (blue), and 13CO2 400 K and 1016 cm−2 (dark red). |
5 Comparison to nearby disks
In this section we present comparisons of the XUE sample with different samples of nearby PPDs. We first discuss the SED shapes of our sample in the context of other young intermediate mass stars (Section 5.1). Then we compare the 10 μm silicate feature to samples of T Tauri and Herbig disks (Section 5.2) and discuss the spectral indices in comparison to a sample of disks in Orion (Section 5.3). Given the mass range of our sample, direct comparisons of the molecular content with similar observations of nearby disks are challenging. JWST observations of nearby Herbig and IMTT stars are difficult due to detector saturation from their intrinsic brightness. Meanwhile, MIR observations with Spitzer lack the necessary signal-to-noise ratio and spectral resolution to detect molecular lines on top of the bright continuum of IMTT or Herbig disks. Consequently, we compare our sample’s molecular content with that of nearby T Tauri stars, while recognizing that the central star’s properties significantly influence inner disk properties, especially toward higher masses. In Section 5.4 we compare the water line luminosity at 17 μm with a samples of nearby disks observed with Spitzer and JWST.
5.1 Spectral energy distribution
Herbig Ae/Be stars and IMTTs typically exhibit bright disk emission at 7 μm (Meeus et al. 2001; Sicilia-Aguilar et al. 2013). A notable characteristic of the XUE sample is the relative weak disk emission compared to the stellar contribution at these wavelengths (see Figure B.1). This difference may be attributed to our sample selection, which focused on sources that could be classified based on their K-band spectra. As a result, the selected disks likely exhibit weak near-infrared emission, which could extend to the 7 μm region as well.
This trend in mid-infrared emission further aligns with the overall properties of the XUE sample, which also exhibits distinct PAH emission characteristics. The XUE sample does not contain any PAH-dominated disks, which contrasts with observations in Herbig Ae/Be stars and IMTT disks where the detection rate is 70 (Acke et al. 2010) and 44% (Valegård et al. 2021), respectively. Notably, only one object in the XUE sample (XUE 10) exhibits clear PAH emission. This discrepancy cannot be solely attributed to the presence of cooler stars, as approximately half of the objects in the (Valegård et al. 2021) sample show PAH emission despite having similar spectral types as the XUE sample. Instead, this suggests that the XUE sample predominantly behaves like Group II disks, which have a lower PAH detection rate (Valegård et al. 2021). The predominance of compact disks and/or disks without a large gap and an outer disk could be attributed to our sample selection as described above, or to prolonged exposure to high UV radiation, which may lead to outer disk evaporation.
5.2 10 μm silicate feature
We analyzed the shape of the 10-μm silicate feature in a similar way to van Boekel et al. (2005) and Kessler-Silacci et al. (2006). In order to minimize the uncertainty of the background subtraction, especially around the PAH band at 11.3 μm we smoothed the MIRI spectrum using a median filter excluding the region between 10.6 and 11.68 μm. For this we used ctool1, setting the threshold parameter to 0.5 such that the smoothed spectrum, Fν,smooth, passes through the median of our observations. We normalized the smoothed spectrum around the 10-μm feature by fitting a linear function to the mean flux of two windows: [7.5–7.7] μm and [13.2–13.6] μm. The normalized spectrum, Sν is given by
![Mathematical equation: $\[S_\nu=1+\frac{F_{\nu, \text { smooth }}-F_{\nu, \text { cont }}}{\left\langle F_{\nu, \text { cont }}\right\rangle},\]$](/articles/aa/full_html/2025/09/aa55456-25/aa55456-25-eq6.png) (1)
(1)
where Fν,smooth is the smoothed observed flux, Fν,cont is the continuum, and ⟨Fν,cont⟩ is the mean value of the continuum between 7.6 and 13.4 μm. The strength of the feature, Fpeak, is then defined as the maximum value of Sν between 6 and 14 μm, and the shape of the feature, F11.3/F9.8, is given by the ratio of Sν at 11.3 and 9.8.
Figure 5 shows the normalized silicate feature for all our sources in ascending order of silicate strength. The thick-solid lines show the smoothed spectra, Fν,smooth, used to calculate the silicate strength and shape, and the thin lines show the observed spectra. The vertical dashed lines mark 9.8 and 11.3 μm and the dots show the strength, Fpeak of each feature.
In Figure 6, we compare the shape and strength of the silicate features in our sample with those observed in T Tauri and Herbig Ae/Be stars from van Boekel et al. (2005), Lommen et al. (2010) and Juhász et al. (2010). Consistent with these previous studies, we find a negative correlation between the feature’s shape and its strength. Our sample spans a broad range of silicate-feature properties and generally exhibits lower F11.3/F9.8 ratios at a given Fpeak compared to nearby T Tauri and Herbig stars. However, van Breemen et al. (2011) demonstrated that the relationship between the 9.7 μm optical depth (τ9.7) and the near-infrared color excess, E(J − K), differs between molecular and diffuse sightlines (see also Chiar et al. 2007). In our analysis, we adopt the extinction law from Gordon et al. (2023), which is derived from diffuse sightlines. This choice may introduce uncertainties in the dereddening process, making it difficult to assess whether the lower F11.3/F9.8 ratios observed in the XUE sample are truly due to variations in grain size. At fixed RV, the adopted AV affects the shape and strength of dust features: stronger and broader features arise for higher AV values. For example, if AV would be 20% higher, the XUE sample’s F11.3/F9.8 distribution diverges further from other datasets, while a 20% lower AV shifts the XUE points upward but still leaves them at the lower edge of the other distributions. In the case of the comparison samples, the authors assume that extinction from nearby sources is negligible, so the spectra are presented without any extinction correction. If the observed differences between the XUE and nearby samples persist, they may indicate that the disk surfaces in the XUE sample are dominated by smaller dust grains. Further investigation is required to determine whether the observed trend reflects an intrinsic dust property or is an artifact of the dereddening approach.
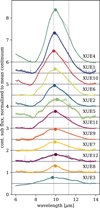 |
Fig. 5 10 μm silicate feature for the XUE sources. The features are continuum subtracted and normalized to the maximum value. The thick solid lines show the smoothed spectra and the thin lines the MIRI observations. The dashed lines mark 9.8 and 11.3 μm and the dot on top of each feature shows the position of the maximum flux. |
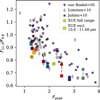 |
Fig. 6 Silicate 10 μm feature strength versus shape. The purple triangles show the Herbig AeBe sources from van Boekel et al. (2005), the gray diamonds show the sample of T-Tauri and Herbig-Ae/Be stars from Lommen et al. (2010), the black stars show the Herbig AeBe sources from Juhász et al. (2010), and the colored squares show the XUE sources. |
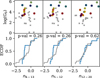 |
Fig. 7 Comparison with a sample of disks with masses >2 M⊙ in Orion (Kim et al. 2016). The top panels show the external FUV flux as a function of each spectral index, the XUE sources are shown with the colored dots and Kim et al. (2016) data with the gray crosses. The bottom panels show the empirical cumulative distribution functions for each index, the p values listed are the result of a Kolmogorov-Smirnov test. |
5.3 Spectral indices
Figure 7 shows the spectral indices n6–13, n5–12, and n12–20 defined as:
![Mathematical equation: $\[n_{\lambda_1-\lambda_2}=\frac{\log _{10}\left(\lambda_1 F_1\right)-\log _{10}\left(\lambda_2 F_2\right)}{\log _{10}\left(\lambda_1\right)-\log _{10}\left(\lambda_2\right)},\]$](/articles/aa/full_html/2025/09/aa55456-25/aa55456-25-eq7.png) (2)
(2)
compared to with those from the Spitzer survey of PPDs in Orion derived by Kim et al. (2016). The top panels show the spectral indices versus the FUV irradiation experienced by the PPDs. We do not detect any significant correlation between the spectral indices and the external FUV flux.
The bottom panels show histograms of the spectral indices of our samples compared to those of the Orion disks. The XUE continuum slopes generally lie within the loci of the Orion slopes. XUE 3 is the only outlier on the n5–12 and n6–13 related plots, and XUE 3 and XUE 5 are possible outliers on the n12–20 related plots. We performed Kolmogorow-Smirnow-Tests to verify the hypothesis that both samples are drawn from the same parent distribution. The obtained p values do not allow us to reject the null hypothesis, suggesting that, for the XUE sources, external irradiation does not significantly alter the disk geometry to the extent that it affects the MIR spectral index.
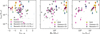 |
Fig. 8 Comparison between the 17 μm H2O luminosity and the spectral index n13–25 (left), the stellar mass (middle) and the stellar luminosity (right) of the XUE disks with the Spitzer sample studied by Banzatti et al. (2020) shown with black squares (M < 2 M⊙) and blue pentagons (M > 2 M⊙) and the MIRI observations of nearby disks from the MINDS collaboration (Gasman et al. 2025). The measurements for the XUE spectra are shown with the colored circles, following the same color scheme as the rest of the paper with arrows showing the upper limits. The upper limits from Banzatti et al. (2020) are indicated with gray arrows. The MINDS sources are shown as magenta diamonds. |
5.4 Water line luminosities
We measured the water line luminosity (LH2O) by integrating the spectra in the [17.075–17.385] μm wavelength range and calculated the errors by measuring the noise between 17.333 and 17.350 μm (see Appendix E). For some sources (XUE 2, 3, 4, 5, 9, and 10), the H2O lines are not clearly detected, and therefore we report only upper limits. The assessment of line detection was made by visual inspection rather than by applying a specific sigma threshold. Figure 8 shows LH2O, against the spectral index n13–25, the stellar mass (M⋆) and the stellar luminosity (L⋆) of our XUE sources in comparison with a sample of T Tauri stars located in nearby (<200 pc), young (1–3 Myr) star-forming regions from Banzatti et al. (2020) and the MINDS collaboration (Gasman et al. 2025). The stellar luminosities for the Spitzer sample were taken from Banzatti et al. (2017). We find that in general the XUE spectral indices are lower than those found in the T Tauri sample, and that the H2O luminosity is at the high end of the distribution. Nearby sources exhibit a trend between H2O luminosity and both M⋆ and L⋆, although this relationship is marked by substantial scatter (e.g., Banzatti et al. 2020; Gasman et al. 2025). In contrast, the XUE sources do not follow this trend; instead, the relation appears to flatten at higher stellar masses and luminosities.
6 Discussion
In this paper we present the first sample of IMTTs observed with MIRI-MRS on board JWST. To investigate the effect of external UV radiation on their inner disk properties, we observed 12 highly irradiated disks in the NGC 6357 region. We classify our sources based on previous studies of stars with similar masses observed with ISO and Spitzer. Our analysis reveals a rich and diverse molecular inventory, including H2O, CO, HCN, C2H2, OH, and 12CO2, along with some 12CO2 isotopologs detected in one of our sources. In Section 5, we compare our sample to nearby disk populations to explore the influence of UV radiation. In this section, we discuss our findings and provide an interpretation.
6.1 Nature of the XUE disks
The disks in our sample are generally more massive (~3 M⊙) than the ones observed around IMTT and Herbig stars (1.5 − 2 M⊙), and as a result, they are significantly younger than those samples, which can be as old as 10 Myr (see Brittain et al. 2023). Despite their youth, the SEDs of the XUE sources suggest that some of these disks are already undergoing advanced stages of clearing. This could be due to our sample selection, as we used the K-band spectral type to identify the disk bearing sources. Thus, each target has a visible photosphere in the NIR. Therefore, it is possible that our sample is biased toward objects which have already (partially) lost their disks. Most of our sources do not exhibit clear signatures of irradiation effects, such as strongly enhanced gas emission lines or prominent PAH features (e.g., Berné et al. 2023; Aru et al. 2024; Zannese et al. 2025, see Sect. 6.5). Additionally, their SEDs are consistent with being absent of large disk gaps, which are typically associated with group I sources. Instead, we observe the presence of inner disk holes. This observation supports the hypothesis, in line with observations of the XUE 1 disk, that the disks are relatively small in size (Ramírez-Tannus et al. 2023; Portilla-Revelo et al. 2025).
Large, gapped disks are often associated with the formation of giant planets that block the inward drift of pebbles. In contrast, the potentially small sizes of the XUE disks could be explained by the rapid inward drift of solid material (Stapper et al. 2022, 2025b), or by the effect of external irradiation due to the FUV photons from the nearby massive stars (see Sect. 6.3). Therefore, it is possible that the XUE disks were never large, that they did not form gas giant planets capable of halting the inward drift, or that they dissipated in a short timescale due to the external irradiation. In all three scenarios, the presence of gas giant planets in wide orbits is unlikely.
Most notably, the XUE spectra suggest that terrestrial planet formation can proceed even in strongly irradiated environments, as the observed disks retain the chemical complexity necessary for forming rocky planets. This is consistent with studies like Richert et al. (2015); Roccatagliata et al. (2011); Fang et al. (2012), which show that inner disks can survive in regions exposed to intense FUV radiation. Together, these observations support the idea that external irradiation does not necessarily inhibit the early stages of terrestrial planet formation.
6.2 Comparison to nearby disks
In Sections 5.1 and 5.3, we compare the spectral shape of the XUE sample with the disks found around stars of similar spectral type in Orion. In terms of spectral shape, the XUE disks appear to closely resemble their nearby counterparts. The 10 μm silicate features of our sample show an offset toward lower values of F11.3/F9.8 compared to nearby T Tauri and Herbig disks. If the difference is robust, this would imply that the disk surfaces may be dominated by smaller grains compared to nearby disks. but if this is due to the extinction correction method then this would imply that external irradiation does not significantly affect the dust composition of the hot, inner disk in IMTTs.
In terms of the molecular content, our sample is the only one in this mass range in which we are able to study the molecular emission with the unprecedented sensitivity of JWST. The XUE sources are cooler, with spectral types G and F, compared to the generally older Herbig Ae/Be stars (spectral types A and B) studied by Spitzer. Disks for which similar observations with JWST exist have masses ≤1 M⊙. Nevertheless, the XUE spectra have significant similarities to T Tauri disks in nearby regions in terms of their molecular content; therefore, in the following we make a parallel between the two samples, even if the central star masses are different. We detect hot (~900 K) H2O in most of our Group II disks, and in half of the Group I disks. Only two disks of the XUE sample show signatures of warm (~400 K) H2O and we do not detect any cold (~200 K) H2O in our sample. This is in contrast with observations of nearby T Tauri disks, in which most disks have a cold water component (Banzatti et al. 2025; Gasman et al. 2025). The lack of a cold water component in the XUE sample could either be due to the external irradiation impinging these disk, or to the strong radiation from the central stars in comparison to T Tauri disks. In order to test this hypothesis, similar observations of IMTTs in non-irradiated environments are needed.
6.3 Disk truncation of the XUE sources
Radiation thermo-chemical models (Antonellini et al. 2015, Hernandez Arboleda, in prep.) predict that flared disks with large outer radii and FUV-heated surface layers can produce strong molecular line emission (e.g., H2O, CO2, C2H2) because the warm extended layers increase the emitting area. In such disks, PAH emission, which is frequently observed in Herbig Ae/Be stars, typically originates from the outer disk surface and traces the spatial distribution of gas (e.g., Lagage et al. 2006; Acke et al. 2010; Yoffe et al. 2023). Given the high stellar luminosities and strong external radiation fields in XUE sources, comparable to or exceeding those of Herbig stars, strong line and PAH emission across the full disk surface would be expected.
However, this is not observed. Only one XUE source (XUE 10) shows detectable PAH emission, and none display particularly high molecular line luminosities compared to nearby disk samples. This lack of enhanced emission features and the absence if PAH features suggests that the XUE disks are truncated, likely as a result of external photoevaporation (see Ramírez-Tannus et al. 2023). Supporting this, Portilla-Revelo et al. (2025) modeled XUE 1 and found that its spectrum can be explained by a truncated disk at approximately 10 au and significantly depleted in gas at larger radii. This result is consistent with observations of the DF Tau system, where the outer disk is truncated by binary interactions, yet the inner disk properties appear unaffected by either the outer disk evolution or the close binary nature (Grant et al. 2024, see also Ndugu et al. (2024)). Direct confirmation of disk truncation in the XUE disks requires ALMA observations to more robustly constrain their spatial extent and mass.
The rest of the XUE sample exhibits similar spectral features and levels of external irradiation, indicating that disk truncation may be common in this environment. In these compact configurations, the inner disk chemistry appears to be governed primarily by the central star rather than by the external radiation field. This interpretation is consistent with ALMA observations of a T Tauri and a Herbig disk in the outskirts of the Orion Nebula Cluster, where external fields of around 100 G0 do not dominate the observed chemical composition (Díaz-Berríos et al. 2024).
Radiation thermo-chemical models of truncated disks provide further support for this scenario (Hernandez Arboleda, in prep.). As disks lose their outer regions, whether through photoevaporation or dynamical processes, the line emission becomes increasingly sensitive to stellar properties such as luminosity and less dependent on the external UV field. Compact disks with radii less than about 30 au can still maintain rich molecular inventories in their inner regions if the midplane remains warm due to stellar irradiation or accretion. Similarly, PAH emission is predicted to decline sharply when the UV-irradiated surface is reduced in size. In disks where the emitting surface is confined within 20–30 au, PAH features weaken significantly or disappear. The absence of PAH emission in 11 of the 12 XUE disks aligns with this prediction. XUE 10, the only exception, shows PAH emission, which may indicate a somewhat less truncated or more flared geometry.
Although the XUE sample is small, it suggests that strong external irradiation environments such as NGC 6357 tend to host compact disks. This has implications for planet formation, as truncated disks may naturally lead to the formation of the compact planetary systems observed by Kepler (e.g., Lissauer et al. 2011; Dawson 2018). However, disk truncation is not unique to irradiated regions. In Lupus, a region with relatively mild external radiation, up to 60 percent of the disk population is also compact (Miotello et al. 2021; Guerra-Alvarado et al. 2025). Therefore, while external irradiation plays an important role, it is not the sole factor driving disk truncation.
6.4 H2O line luminosities
The XUE sample displays a wide range of H2O line luminosities and most of the disks show luminosities that are high but comparable to those found in non-irradiated disks in nearby star-forming regions (see Figure 8, Banzatti et al. 2020, 2022; Gasman et al. 2025) even if the stellar masses and luminosities are higher than those of the central stars in nearby regions. This suggest that the relation between H2O luminosity and L⋆ (or M⋆) flattens beyond ~2 M⊙. As discussed in Section 6.3, disk truncation reduces the warm disk surface layers and could explain why line luminosities are not strongly enhanced (Ramírez-Tannus et al. 2023; Portilla-Revelo et al. 2025, Hernandez Arboleda, in prep.).
Another possibility to explain the flattening of the H2O line luminosity versus L⋆ (or M⋆) could be that in our sources, which span a higher mass range, the dust continuum emission is higher (Brittain et al. 2023), and therefore the H2O lines do not seem as enhanced as expected. However, other important parameter that determine the line luminosities is the accretion rate (e.g., Banzatti et al. 2020), which is poorly constrained by current observations. JWST NIRSpec observations are needed to get an estimate of the accretion luminosity of these sources (e.g., Rogers et al. 2025).
6.5 Lack of distinct chemistry due to external irradiation
JWST observations of irradiated disks around low-mass stars in the Orion Nebula Cluster (ONC) show clear signs of external irradiation, such as OH produced by photodissociation of water, CH+, and ![Mathematical equation: $\[\mathrm{CH}_{3}^{+}\]$](/articles/aa/full_html/2025/09/aa55456-25/aa55456-25-eq8.png) produced by photochemistry, as well as C I fluorescence and molecular H2 (Berné et al. 2023; Zannese et al. 2023; Aru et al. 2024; Goicoechea et al. 2024; Zannese et al. 2025).
produced by photochemistry, as well as C I fluorescence and molecular H2 (Berné et al. 2023; Zannese et al. 2023; Aru et al. 2024; Goicoechea et al. 2024; Zannese et al. 2025). ![Mathematical equation: $\[\mathrm{CH}_{3}^{+}\]$](/articles/aa/full_html/2025/09/aa55456-25/aa55456-25-eq9.png) has also been detected in the nearby disk TW Hya. By means of thermochemical models, Henning et al. (2024) conclude that the
has also been detected in the nearby disk TW Hya. By means of thermochemical models, Henning et al. (2024) conclude that the ![Mathematical equation: $\[\mathrm{CH}_{3}^{+}\]$](/articles/aa/full_html/2025/09/aa55456-25/aa55456-25-eq10.png) emission must originate from the transition regime from optically thin to thick at the gap edge of a radially extended disk.
emission must originate from the transition regime from optically thin to thick at the gap edge of a radially extended disk.
Surprisingly, none of the XUE sources, even if exposed to similar levels of external irradiation as the proplyds in the ONC, show any of these external irradiation indicators. As discussed in Section 6.3, the XUE disks could be truncated. Additionally, the fact that we do not see signs of photo-evaporation in the spectra could indicate that these disks have already mostly evaporated; Given the mass-loss rates measured for proplyds in the ONC (e.g., O’dell et al. 1993; Johnstone et al. 1998; Henney & O’Dell 1999; Facchini et al. 2016; Haworth et al. 2018, 2023), it is expected that the evaporation phase is short lived (see e.g., Winter et al. 2019), and therefore it is possible that the XUE sources are already at a post-proplyd state. The lack of an outer disk would imply that there is no volume of gas which is dense enough to produce ![Mathematical equation: $\[\mathrm{CH}_{3}^{+}\]$](/articles/aa/full_html/2025/09/aa55456-25/aa55456-25-eq11.png) emission even in the presence of gaps like in the case of TW Hya, explaining the lack of this molecule in our observations (see Fig. 5 in Portilla-Revelo et al. 2025).
emission even in the presence of gaps like in the case of TW Hya, explaining the lack of this molecule in our observations (see Fig. 5 in Portilla-Revelo et al. 2025).
If the XUE disks were at a post-evaporation stage, it is possible that by putting together observations of proplyds in the ONC and the XUE sample we would be looking at an evolutionary sequence for externally irradiated disks. However, it is important to note that the central stars of the XUE sample have higher masses than the ones of the ONC disks observed with JWST. The latter could influence the physical conditions of the inner disks, which could also explain the differences in the observed signatures.
7 Conclusions
We present the Extreme UV Environments (XUE) sample of 12 IMTTs located in the three subclusters of the giant ~1 Myr old H II region NGC 6357. This is the first sample spanning this mass range (1–4 M⊙) that has been observed with MIRI-MRS on board JWST and provides an opportunity to study the inner disk physical and chemical properties with the unprecedented sensitivity of JWST. In the following, we summarize the main findings from this paper.
Our observations of externally irradiated IMTTs show an inner disk chemical inventory similar to that of non-irradiated T Tauri disks. To better understand the effect of the environment on the XUE disks, observations of non-irradiated IMTTs with similar sensitivity and spectral resolution are needed for comparison.
The spectral indices of the XUE sample are similar to those of their nearby counterparts. All XUE sources show silicate 10 μm emission, with generally lower F11.3/F9.8 ratios at a given Fpeak compared to nearby T Tauri and Herbig stars. Further investigation is needed to determine whether this difference is due to the dust properties in the inner disk.
None of the XUE sources show cold (~200 K) water emission and only two of them show warm (~400 K) water. 60–90% of our Group II disks and both of the Group I flaring disks show emission from hot (~900 K) water in their inner disks, showing that rocky planets can form in the presence of water, even in these extreme environments.
Unlike the proplyds in Orion, the XUE disks do not exhibit distinct chemistry compared to non-irradiated disks, suggesting that these disks might be truncated. This would reduce the emission area of molecules such as H2O, HCN, and C2H2, leading to line fluxes similar to those observed in nearby disks. This could imply that the XUE disks are in a later stage of evolution, where the outer disk has been fully photoevaporated.
Our observations show the potential of JWST to study PPDs in distant regions (>1.5 kpc). This opens a new window to study disks around intermediate and high-mass stars, most of whose nearby counterparts will saturate with JWST. They also reiterate the need to observe non-irradiated disks around stars of similar stellar masses as the XUE sample in order to have a comparison sample and determine the effect of external irradiation in the inner disk of PPDs.
Data availability
The full version of Table A.2 and the reduced spectra are available at the CDS via https://cdsarc.cds.unistra.fr/viz-bin/cat/J/A+A/701/A139
Acknowledgements
We thank the anonymous referee for their constructive comments that helped improve this manuscript. M.C.R-T. acknowledges support by the German Aerospace Center (DLR) and the Federal Ministry for Economic Affairs and Energy (BMWi) through program 50OR2314 ‘Physics and Chemistry of Planet-forming disks in extreme environments’. A.B. and J.F. acknowledge support from the Swedish National Space Agency (2022-00154). Support for B.P-R. within program #1759 was provided by NASA through a grant from the Space Telescope Science Institute, which is operated by the Association of Universities for Research in Astronomy, Inc., under NASA contract NAS 5–26555. T.J.H. acknowledges UKRI guaranteed funding for a Horizon Europe ERC consolidator grant (EP/Y024710/1) and a Royal Society Dorothy Hodgkin Fellowship. The work of T.P. was partly supported by the Excellence Cluster ORIGINS which is funded by the Deutsche Forschungsgemeinschaft (DFG, German Research Foundation) under Germany’s Excellence Strategy - EXC-2094 - 390783311 V.R. acknowledges the support of the European Union’s Horizon 2020 research and innovation program and the European Research Council via the ERC Synergy Grant “ECOGAL” (project ID 855130). E.S. is supported by the international Gemini Observatory, a program of NSF NOIRLab, which is managed by the Association of Universities for Research in Astronomy (AURA) under a cooperative agreement with the U.S. National Science Foundation, on behalf of the Gemini partnership of Argentina, Brazil, Canada, Chile, the Republic of Korea, and the United States of America. This work is based [in part] on observations made with the NASA/ESA/CSA James Webb Space Telescope. The data were obtained from the Mikulski Archive for Space Telescopes at the Space Telescope Science Institute, which is operated by the Association of Universities for Research in Astronomy, Inc., under NASA contract NAS 5-03127 for JWST. These observations are associated with program #1759. This publication makes use of VOSA, developed under the Spanish Virtual Observatory (svo.cab.inta-csic.es) project funded by MCIN/AEI/10.13039/501100011033/ through grant PID2020-112949GB-I00. This research has made use of the SIMBAD database, operated at CDS, Strasbourg, France (Wenger et al. 2000). This research used the SpExoDisks Database at spexodisks.com (Wheeler et al. 2024). Software: Matplotlib (Hunter 2007), NumPy (van der Walt et al. 2011), SciPy (Virtanen et al. 2020), Astropy (Astropy Collaboration 2013, 2018, 2022), dust_extinction (Gordon 2024).
Appendix A Cluster membership and mass determination
A.1 Gaia counterparts of the XUE sources
We searched for Gaia counterparts within 1″ of our remaining 12 targets using the coordinates from the MYStIX catalog. We found Gaia DR3 counterparts for all targets. In order to test whether the Gaia matches are really the counterparts to the XUE targets, we inspected the available HST and 2MASS images. HST images were only available for some of the disks in Pis 24 (XUE 1, 2, and 3), the remaining targets were inspected using 2MASS. This confirmed that the Gaia matches found within 1″ are the counterparts of our targets.
The Gaia DR3 parallaxes of XUE 3, 4, 5, 9, and 10 were corrected using the algorithm by Lindegren et al. (2021) for the other targets, this was not possible. Most of the parallaxes agree within their 3σ uncertainty interval with the distance interval of [1.635 − 1.705] kpc based on the known OB population of NGC 6357 (Ramírez-Tannus et al. 2023). Only the parallax of XUE 6 does not agree with the interval; however, this target has a Gaia DR3 re-normalized unit weight error (RUWE) larger than 1.4 which indicates a poor fit of the astrometric solution (Lindegren et al. 2018). Figure A.1 shows the parallaxes of the XUE sources in comparison to those of the O-type stars in the region. And the Gaia parallaxes of our sources are listed in Table A.2.
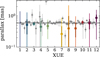 |
Fig. A.1 Gaia DR3 parallaxes of our sources in comparison to those of the O stars in the region (gray). The vertical thick and thin lines correspond to the 1σ and 3σ uncertainty in the parallax measurement. The horizontal black line shows the parallax at 1/1.663 mas corresponding to our determined mean distance and the dashed black lines show the parallax of the interval at [1/1.763, 1/1.563] mas. |
A.2 Photometric data
The photometric data were taken from the MYStIX catalog (Feigelson et al. 2013; King et al. 2013; Kuhn et al. 2013) which includes the JHK-band magnitudes from the United Kingdom Infra-red Telescope (UKIRT) wide field camera (Lawrence et al. 2007; Lucas et al. 2008), plus the four Spitzer IRAC bands (GLIMPSE; Benjamin et al. 2003). In the specific case of XUE 10, we used VVV NIR photometry for the J, H, and K-bands. The near- and mid-infrared color-magnitude diagrams (CMDs) and color-color diagrams (CCDs) are shown in Figure A.2 and are discussed in the next section.
A.3 Extinction and mass determination
Values for the total to selective extinction RV vary in the literature from 3.1 (Maíz Apellániz et al. 2007) to 3.7 (Bohigas et al. 2004; Russeil et al. 2012). In this paper, we calculated an average RV = ![Mathematical equation: $\[3.30_{-0.19}^{+0.13}\]$](/articles/aa/full_html/2025/09/aa55456-25/aa55456-25-eq12.png) by selecting all 78 sources within a cone of 15′ radius centered at (RA, Dec) = (261.269027, −34.315231) from the Fouesneau et al. (2022) catalog, which offers a uniformly derived set of astrophysical parameters for over 123 million stars, enabling detailed studies of dust extinction and average grain size along the line of sight. The catalog provides stellar parameters, including RV, based on data from Gaia DR2, 2MASS, and ALLWISE. We used all available sources in this region without applying any additional quality cuts, and computed the median RV value and its uncertainties from the 16th and 84th percentiles to characterize the local extinction properties.
by selecting all 78 sources within a cone of 15′ radius centered at (RA, Dec) = (261.269027, −34.315231) from the Fouesneau et al. (2022) catalog, which offers a uniformly derived set of astrophysical parameters for over 123 million stars, enabling detailed studies of dust extinction and average grain size along the line of sight. The catalog provides stellar parameters, including RV, based on data from Gaia DR2, 2MASS, and ALLWISE. We used all available sources in this region without applying any additional quality cuts, and computed the median RV value and its uncertainties from the 16th and 84th percentiles to characterize the local extinction properties.
Using the spectral classification from Ramírez-Tannus et al. (2020) and RV = 3.3 mag for NGC 6357 (Massi et al. 2015; Russeil et al. 2017; Fouesneau et al. 2022), we compared the NIR photometry (Section A.2) of XUE stars with PARSEC 1.2S premain sequence (PMS) evolutionary models (Bressan et al. 2012) on the J versus J − H color-magnitude diagram (Figure A.2a). This analysis, which minimizes the influence of circumstellar disks, provided estimates for stellar ages, extinctions, masses, and bolometric luminosities.
The results indicate that the NIR photometry of XUE G/K-type stars corresponds to a stellar age of ~ 0.7 Myr, while the observed properties of A/F-type stars suggest slightly older ages of (1.5 − 2) Myr. The 0.7 Myr age for G/K-type stars agrees with the median age for hundreds of NGC 6357 members derived using PARSEC models by Getman et al. (2022). However, the PARSEC-based ages for G/K-type stars are systematically lower than the Siess (Siess et al. 2000) model-based ages of (1 − 1.5) Myr previously calculated for NGC 6357 members (Getman et al. 2014b). Regardless of the PMS evolutionary model used, NGC 6357 stars have ages comparable to the Orion Nebula Cluster (ONC) and the stellar populations of its underlying Orion Molecular Cloud One (OMC-1 Getman et al. 2014a, 2022). These young ages align with the fact that neither NGC 6357 nor the ONC has experienced supernova explosions (SNe) yet. This is supported by the absence of known supernova remnants, non-thermal emission, or chemically enriched hot plasma in their diffuse X-ray and radio emission, as well as the continued presence of massive O-type stars and lack of known pulsars or neutron stars (e.g., Güdel et al. 2008; Wang et al. 2007; Westmoquette et al. 2010; Gvaramadze et al. 2011; Povich et al. 2017).
In contrast to the ONC, which is dominated by a single O6-type star, θ1OriC, NGC 6357 hosts at least a dozen O-type stars with spectral types earlier than O7. These massive stars have efficiently ablated central regions of their parental molecular cloud, carving out large cavities and leaving behind smaller, dense, bright-rimmed clouds. Several stellar clusters, including the prominent Pismis 24, are now exposed, yet remain surrounded by extensive reservoirs of dense molecular material.
Despite this molecular erosion, many X-ray- and NIR-detected cluster members in NGC 6357 still exhibit significant extinction, attributed to both local dust and the interstellar medium. Figures A.2a and A.2b show that typical extinction values in NGC 6357 range from several to over ten magnitudes – higher than those in the ONC but comparable to OMC-1. Similarly, the XUE stars display high extinction values, aligning with the correlation between X-ray column densities and visual-band extinctions observed for stars in both NGC 6357 and the Orion Nebula (Figure A.2f).
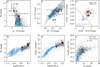 |
Fig. A.2 Characteristics of XUE stars. In all panels, XUE stars are color-coded and labeled for clarity. The Orion Nebula young stars are represented by blue plus symbols, and NGC 6357 young stars are shown as gray crosses (Getman et al. 2005; Broos et al. 2013; King et al. 2013; Townsley et al. 2019; Getman et al. 2022). (a, b) UKIRT/VVV NIR color-magnitude and color-color diagrams. PARSEC 1.2S PMS isochrones for 0.7 and 2 Myr are shown as solid and dashed curves, respectively. Reddening vectors corresponding to AV = 10 mag are drawn as solid and dashed lines, originating from G0 stars at 0.7 Myr and F0 stars at 2 Myr. (c) Spitzer-IRAC MIR color-color diagram of NGC 6357 young stars with known IRAC photometry. Gray squares represent known disky stars, while purple circles indicate diskless stars (Povich et al. 2013). (d) Absolute K-band magnitude (uncorrected for extinction) as a function of stellar mass. (e) Intrinsic X-ray luminosity as a function of stellar mass. (f) X-ray column density plotted against visual-band extinction. The names of the sources are displayed on the markers and are visible when zooming in. |
NIR and mid-infrared (MIR) color-color diagrams (Figures A.2b, A.2c) indicate that most XUE stars host optically thick disks, as evidenced by strong Ks-band excesses. These stars, along with other NGC 6357 disky members, are clearly distinguishable from diskless X-ray-emitting young stars.
The X-ray luminosities of G/K-type XUE stars are consistent with their intermediate masses (Figure A.2e). In contrast, the A/F-type stars XUE 3 and XUE 10 are undetected in X-rays, likely due to their developed radiative cores, which suppress magnetic dynamos and reduce X-ray emission (Nuñez et al. 2021; Getman et al. 2022).
A.4 Assumed OB stars properties
Section 2.1 describes how we calculated the external FUV flux to which the XUE sources are exposed. Table A.1 lists the assumed OB stars’ properties to obtain the Phoenix atmosphere models.
A.5 Properties of the XUE sample
Table A.2 contains all the data used and derived in this paper for the XUE sources. The full table is available at the CDS.
Appendix B Full spectral energy distributions
Figure B.1 shows the SEDs of our sources together with the existing photometry and stellar models corresponding to the luminosities and temperatures derived in Section A.3.
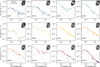 |
Fig. B.1 Spectral energy distributions of the XUE sources. Each column shows the sources in one region: Pis 24, G353.1+0.6 and G353.1+0.7 from left to right. The dashed lines show Phoenix (Brott & Hauschildt 2005) and Kurucz (Kurucz 1993) stellar photospheres with the parameters derived in Section A.2. The dots show UKIRT and IRAC photometry, with the exception of XUE 10 in which VISTA photometry is displayed. The solid line shows the MIRI MRS spectrum. The light colors show the observed data, the dark ones show the dereddened data. The panels in the top-left of each subfigure show the MRS data cube at 5.5 μm. |
Spitzer observations of disks in nearby regions (e.g., Sicilia-Aguilar et al. 2007, 2006) found a large diversity in spectral shapes. Our sample of highly irradiated disks also resembles the above mentioned diversity. Given that our selection criteria included having determined the spectral types of the central sources based on their K–band spectrum (Section 2.1), it is expected that they lack a strong NIR excess indicating that the might have undergone substantial clearing. Based on Figure 3 we can classify our sources into three categories: XUE 2, 4, and 5 are disks that show NIR and MIR emission similar to stellar photospheres. The SEDs XUE 1, 6, 7, 8, 9, 11, and 12 show moderate emission in the K–band and significant MIR emission, which XUE 1 and 7 showing increasing flux beyond 20 μm. Finally, XUE 3 and 10 display SEDs with little to no NIR excess and steadily increasing emission in the MIR, especially in the case of XUE 3.
Assumed properties for the massive stars in the NGC 6357 region.
Adopted and derived properties of the XUE sources.
Appendix C Key regions of molecular emission
Figures C.1, C.2, C.3 and C.4 show overviews of regions of the spectra where key molecular lines are present.
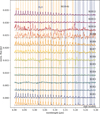 |
Fig. C.1 Overview of the spectral region between 4.9 and 5.3 μm for all XUE sources. The lowermost spectrum shows the most prominent molecules in this region; CO at a temperature of 1500 K and a column density of 3×1017 cm−2 (yellow) and H2O at 850 K and 1018 cm−2 (blue). |
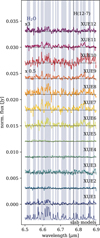 |
Fig. C.2 Same as Figure C.1 but for the region between 6.5 and 6.9 μm. The lowermost spectrum shows H2O at 850 K and 1018 cm−2 (blue). |
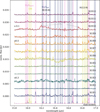 |
Fig. C.3 Same as Figure C.1 but for the region between 15.8 and 17 μm. The lowermost spectrum shows OH at 600 K and 1016 cm−2 (green). |
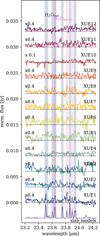 |
Fig. C.4 Same as Figure C.1 but for the region between 23.2 and 24.3 μm. The lowermost spectrum shows warm and hot H2O at 400 K and 2.2 × 1016 cm−2 (blue) and at 900 K and 2.2 × 1016 cm−2 (purple). |
Appendix D Description of individual sources
In the following we describe the SED shape and molecular content of each source individually.
XUE 1. This source was analyzed in detail by Ramírez-Tannus et al. (2023) and Portilla-Revelo et al. (2025). There are three sources in the MRS data cube, one at 1.5″ from the disk bearing source and another one 0.2″ away. The two closest sources are not resolved in the MIRI cubes, and source three is not detected redward of ~ 9 μm (see Ramírez-Tannus et al. 2023, for a detailed discussion). The prominent 10 μm silicate emission indicates the presence of small, partially crystalline silicate dust at the disk surface. They find abundance of water, CO, 12CO2, HCN, C2H2. Here we confirm the presence of two water components at different temperatures around 24 μm as indicated by Banzatti et al. (2023) (Figure C.4). In addition to the molecules reported in Ramírez-Tannus et al. (2023), we detect weak OH lines at 16 and 16.80 μm (Figure C.3). The spectrum also contains hydrogen recombination lines. In particular we detect the Pfund line (H(6-5) at 7.4598 μm) and some lines of the Humpreys series: H(10-6) at 5.1286 μm, H(9-6) at 5.9082 μm, H(8-6) at 7.5025 μm, H(7-6) at 12.3719 μm. Additionally we detect weak lines corresponding to H2 (0-0) transitions, S(3) at 9.66 μm is prominent, and S(1), S(4), S(5), S(7) are potentially detected.
XUE 2. This is a single source in the MRS cube up to channel 4 where a few bright sources are detected around XUE 2. None of these additional sources overlap with XUE2, and thus they do not contaminate the extracted spectrum. The MIRI flux is higher than the Spitzer photometry, which might indicate that this source is variable. Examples of variability detected with Spitzer and MIRI have been also observed in nearby disks (e.g., Perotti et al. 2023). The SED shape has a change of slope between 8-12 and 24 μm, which could indicate the presence of an inner hole. This source is relatively poor in its molecular content. We detect a few lines corresponding to the P-branch CO fundamental emission between 4.9 and 5.0 μm for the v = 1 − 0 transitions, unlike the case of XUE 1 there is no significant detection of CO lines corresponding to the v = 2 − 1 transitions. Due to the low signal-to-noise of the MIRI spectrum, we cannot confirm or reject the presence of water emission between 6 and 7 μm, HCN at 14 μm, CO2 at 15 μm or OH at 16 and 16.80 μm. We do not detect any presence of C2H2, water beyond 15 μm nor 13CO2. There is an excess emission in the spectrum at ~7.2 μm, which is consistent with the location of ![Mathematical equation: $\[\mathrm{CH}_{3}^{+}\]$](/articles/aa/full_html/2025/09/aa55456-25/aa55456-25-eq13.png) as detected by Berné et al. (2023); nevertheless, due to the low S/N and to the potential presence of water at the same wavelengths, we are not able to accurately model this molecule and therefore cannot confirm its presence in the spectrum. The spectrum contains the Pfund H(6-5) line in emission.
as detected by Berné et al. (2023); nevertheless, due to the low S/N and to the potential presence of water at the same wavelengths, we are not able to accurately model this molecule and therefore cannot confirm its presence in the spectrum. The spectrum contains the Pfund H(6-5) line in emission.
XUE 3. In channels 1 and 2 XUE 3 is the only source in the detector, in channel 3 two extra sources are detected, the background in channel 4 is very bright, making the source almost undetectable. The extra sources detected in channel 3 do not contaminate the extraced spectrum. The Spitzer photometric points are higher than the MIRI spectrum, these could be due to the Spitzer photometry being contaminated by the strong background emission. The spectrum does not show any molecular emission and shows weak 10 μm silicate emission. The strong rising of the MIRI SED at larger wavelengths together with the lack of strong NIR excess suggests the presence of a inner hole or a large disk gap.
XUE 4. This source is the only one in the detector and it is prominent in all channels. Its SED does not show any K-band excess and the MIRI MRS spectrum has a negative slope between 5 and 8 μm. Making it a good candidate for a transition disk. It has a prominent 10 μm silicate feature, with a red shoulder that indicates the presence of crystalline silicates. We also identify clear forsterite bands at 16 and 19 μm in the MIRI spectrum. It is not possible to identify any molecular emission in the spectrum.
XUE 5. There are 3 non-overlapping sources clearly detected in all channels, one to the lower right part of the detector (SW), and the third source located to the lower-left of the second source. The third source is only detected at the shortest wavelengths. At the longest wavelength, there is very bright emission on the top left corner of the detector (NE) that dominates the emission in the data cube. The background spectrum of XUE 5 is very rich in PAHs and there are some remnants of the background subtraction left in the spectrum. The blue part of the MIRI spectrum has a negative slope and might present absorption lines coming from the stellar photosphere. With the exception of H2 (0-0) S(4) and S(5), there are no molecular emission lines detected in the MIRI spectrum. The lack of any NIR excess, together with the lack of molecular emission that XUE 5 has a very gas and dust-depleted inner disk, consistent with a transitional disk.
XUE 6. This is a single source in detector in all channels, but there is a lot of nebulosity visible in the redder channels at the top-right of the detector. The PAH emission from the background is very strong, and some remnants of it are left in absorption in the spectrum after the background subtraction. The SED shape is consistent with a continuous disk, with the flux constantly decreasing toward longer wavelengths. XUE 6 has a relatively rich molecular inventory: we detect some transitions corresponding to the P-branch of the CO fundamental, H2O emission between 6 and 7 μm, as well as HCN, C2H2, and CO2. The H2 corresponding to the 0-0 S(5) transition at 6.90952 μm is also visible in the spectrum.
XUE 7. There are several fainter point sources in the detector close to XUE 7, which could explain the fact that the Spitzer fluxes are slightly higher than the MIRI spectrum. Toward the red end of channel 3 at around 15 μm, there is a bright source overlapping with XUE 7 which could be the reason why the SED has a change of slope at around 16 μm. XUE 7 has a relatively weak 10 μm emission feature and shows prominent CO, CO2, and H2O lines. Weaker emission from HCN, C2H2 and OH is also detected in the MIRI spectrum.
XUE 8. In most channels XUE 8 appears as a single source in the detector. As well as for XUE 7, the SED shape suggests a full disk. XUE 8’s silicate emission feature at 10 μm has an uncommon shape, having a lower flux at 11.3 μm than expected for its peak flux. Its spectrum is extremely rich in molecular emission. It has very strong water emission across the spectrum as well as prominent CO, HCN, CO2, H2, and OH lines. Due to the abundance of water lines in the 13 to 16 μm range, we cannot confirm or reject the presence of C2H2 nor 13CO2 in the spectrum.
XUE 9. This source appears single at all wavelengths and there is very strong nebular emission in the redder channels. The SED slope decreases constantly toward longer wavelengths consistent with a full disk. This source does not show a lot of molecular richness; There is emission from hot water at around 6 μm, but we cannot confirm the presence of other molecules.
XUE 10. This is the brightest source in our sample and it is single in the detector at all wavelengths. The Spitzer fluxes are higher than the MIRI SED indicating possible variability. XUE 10 SED’s flux increases steeply redward of 12 μm. XUE 10 has a strong silicate feature at 10 μm with a prominent emission feature at 11.3 μm that is probably a combination of forsterite and PAH emission. The spectrum also shows strong PAH emission at 6.2 μm. XUE 10 has a very peculiar chemical content, it is very water poor but shows very prominent emission from 12CO2, including 13CO2, and even the rarer isotopologs 16OC18O and 16OC17O (see Frediani et al. 2025, for a full analysis of this spectrum).
XUE 11. This source is single in the MRS field-of-view, its brightness with respect to the background decreases significantly in channel 4. XUE 11’s SED is consistent with that of a full disk, with the flux decreasing toward longer wavelengths. We tentatively detect CO around 5 μm, hot water at ~ 6 μm and HCN at 14 μm. Given the quality of the spectrum, it is not possible to identify other molecules.
XUE 12. This source consists of three stars very close to each other; therefore, the photometric points, as well as our mass estimates need to be taken as upper limits. Around ~ 15 μm, the three sources become indistinguishable in the MIRI detector. This is likely because the two additional sources are foreground contaminants that appear very faint at longer wavelengths. However, there remains a possibility that, beyond this wavelength, our 1D spectrum may be affected by emission lines from these nearby sources. The source becomes extremely faint toward channel 4, making it indistinguishable from the background. The MIRI SED decreases continuously with wavelength, but given that the stellar SED is uncertain, it is not possible to determine where the infrared excess starts to determine the inner disk structure. XUE 12 is rich in molecules: we detect prominent CO and 12CO2, including the possible presence of 13CO2. We also detect hot and warm H2O and HCN. We cannot confirm or reject the presence of C2H2.
Appendix E Water lines at 17 μm
In this section we show the spectra used to determine the water line luminosity (LH2O) for all the XUE sources. As in Najita et al. (2013) and Banzatti et al. (2020), we integrated the spectrum over the full wavelength range shown in the plots. The measurement error was determined from the [17.333–17.350] μm region. Dashed lines in the figure indicate three distinct emission features at 17.101 μm, 17.223 μm, and 17.356 μm. Each of those lines consists of multiple H2O transitions, and is dominated by the rotational transitions 125 8 → 112 9, 113 9 → 100 10, and 112 9 → 101 10, respectively (e.g., Table 3 in Banzatti et al. 2017).
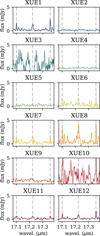 |
Fig. E.1 Water emission at 17 μm for the XUE sources. For XUE 2, 3, 4, 5, 9, and 10 it was not possible to significantly detect the water lines, we therefore report only upper limits. The vertical lines show the location of three well-separated emission features at 17.101 μm, 17.223 μm, and 17.356 μm. |
References
- Acke, B., Bouwman, J., Juhász, A., et al. 2010, ApJ, 718, 558 [Google Scholar]
- Allen, M., Anania, R., Andersen, M., et al. 2025, Open J. Astrophys., 8, 54 [Google Scholar]
- Ansdell, M., Williams, J. P., Manara, C. F., et al. 2017, AJ, 153, 240 [Google Scholar]
- Antonellini, S., Kamp, I., Riviere-Marichalar, P., et al. 2015, A&A, 582, A105 [NASA ADS] [CrossRef] [EDP Sciences] [Google Scholar]
- Antonellini, S., Kamp, I., Lahuis, F., et al. 2016, A&A, 585, A61 [NASA ADS] [CrossRef] [EDP Sciences] [Google Scholar]
- Appenzeller, I., & Mundt, R. 1989, A&A Rev., 1, 291 [NASA ADS] [CrossRef] [Google Scholar]
- Arabhavi, A. M., Kamp, I., Henning, T., et al. 2024, Science, 384, 1086 [NASA ADS] [CrossRef] [Google Scholar]
- Aru, M. L., Maucó, K., Manara, C. F., et al. 2024, A&A, 692, A137 [NASA ADS] [CrossRef] [EDP Sciences] [Google Scholar]
- Astropy Collaboration (Robitaille, T. P., et al.) 2013, A&A, 558, A33 [NASA ADS] [CrossRef] [EDP Sciences] [Google Scholar]
- Astropy Collaboration (Price-Whelan, A. M., et al.) 2018, AJ, 156, 123 [Google Scholar]
- Astropy Collaboration (Price-Whelan, A. M., et al.) 2022, ApJ, 935, 167 [NASA ADS] [CrossRef] [Google Scholar]
- Banzatti, A., Pontoppidan, K. M., Salyk, C., et al. 2017, ApJ, 834, 152 [NASA ADS] [CrossRef] [Google Scholar]
- Banzatti, A., Pascucci, I., Bosman, A. D., et al. 2020, ApJ, 903, 124 [NASA ADS] [CrossRef] [Google Scholar]
- Banzatti, A., Abernathy, K. M., Brittain, S., et al. 2022, AJ, 163, 174 [NASA ADS] [CrossRef] [Google Scholar]
- Banzatti, A., Pontoppidan, K. M., Carr, J. S., et al. 2023, ApJ, 957, L22 [NASA ADS] [CrossRef] [Google Scholar]
- Banzatti, A., Salyk, C., Pontoppidan, K. M., et al. 2025, AJ, 169, 165 [Google Scholar]
- Benjamin, R. A., Churchwell, E., Babler, B. L., et al. 2003, PASP, 115, 953 [Google Scholar]
- Berné, O., Martin-Drumel, M.-A., Schroetter, I., et al. 2023, Nature, 621, 56 [CrossRef] [Google Scholar]
- Bohigas, J., Tapia, M., Roth, M., & Ruiz, M. T. 2004, AJ, 127, 2826 [Google Scholar]
- Bressan, A., Marigo, P., Girardi, L., et al. 2012, MNRAS, 427, 127 [NASA ADS] [CrossRef] [Google Scholar]
- Brittain, S. D., Kamp, I., Meeus, G., Oudmaijer, R. D., & Waters, L. B. F. M. 2023, Space Sci. Rev., 219, 7 [NASA ADS] [CrossRef] [Google Scholar]
- Broos, P. S., Getman, K. V., Povich, M. S., et al. 2013, ApJS, 209, 32 [NASA ADS] [CrossRef] [Google Scholar]
- Brott, I., & Hauschildt, P. H. 2005, ESA Special Publication, 576, 565 [NASA ADS] [Google Scholar]
- Bushouse, H., Eisenhamer, J., Dencheva, N., et al. 2024, JWST Calibration Pipeline (USA: NASA) [Google Scholar]
- Calvet, N., Muzerolle, J., Briceño, C., et al. 2004, AJ, 128, 1294 [NASA ADS] [CrossRef] [Google Scholar]
- Carr, J. S., & Najita, J. R. 2008, Science, 319, 1504 [Google Scholar]
- Chiar, J. E., Ennico, K., Pendleton, Y. J., et al. 2007, ApJ, 666, L73 [NASA ADS] [CrossRef] [Google Scholar]
- Churchwell, E., Watson, D. F., Povich, M. S., et al. 2007, ApJ, 670, 428 [NASA ADS] [CrossRef] [Google Scholar]
- Dawson, R. I. 2018, in Handbook of Exoplanets, eds. H. J. Deeg, & J. A. Belmonte (Berlin: Springer), 114 [Google Scholar]
- Decleir, M., Gordon, K. D., Andrews, J. E., et al. 2022, ApJ, 930, 15 [NASA ADS] [CrossRef] [Google Scholar]
- Díaz-Berríos, J. K., Guzmán, V. V., Walsh, C., et al. 2024, ApJ, 969, 165 [CrossRef] [Google Scholar]
- Dotter, A. 2016, ApJS, 222, 8 [Google Scholar]
- Facchini, S., Clarke, C. J., & Bisbas, T. G. 2016, MNRAS, 457, 3593 [NASA ADS] [CrossRef] [Google Scholar]
- Fang, M., van Boekel, R., King, R. R., et al. 2012, A&A, 539, A119 [NASA ADS] [CrossRef] [EDP Sciences] [Google Scholar]
- Fatuzzo, M., & Adams, F. C. 2008, ApJ, 675, 1361 [NASA ADS] [CrossRef] [Google Scholar]
- Feigelson, E. D., Townsley, L. K., Broos, P. S., et al. 2013, ApJS, 209, 26 [Google Scholar]
- Fitzpatrick, E. L., Massa, D., Gordon, K. D., Bohlin, R., & Clayton, G. C. 2019, ApJ, 886, 108 [Google Scholar]
- Fouesneau, M., Andrae, R., Dharmawardena, T., et al. 2022, A&A, 662, A125 [NASA ADS] [CrossRef] [EDP Sciences] [Google Scholar]
- Frediani, J., Bik, A., Ramírez-Tannus, M. C., et al. 2025, arXiv e-prints [arXiv:2507.13921] [Google Scholar]
- Garufi, A., Meeus, G., Benisty, M., et al. 2017, A&A, 603, A21 [NASA ADS] [CrossRef] [EDP Sciences] [Google Scholar]
- Gasman, D., van Dishoeck, E. F., Grant, S. L., et al. 2023, A&A, 679, A117 [NASA ADS] [CrossRef] [EDP Sciences] [Google Scholar]
- Gasman, D., Temmink, M., van Dishoeck, E. F., et al. 2025, A&A, 694, A147 [NASA ADS] [CrossRef] [EDP Sciences] [Google Scholar]
- Getman, K. V., Flaccomio, E., Broos, P. S., et al. 2005, ApJS, 160, 319 [NASA ADS] [CrossRef] [Google Scholar]
- Getman, K. V., Feigelson, E. D., & Kuhn, M. A. 2014a, ApJ, 787, 109 [NASA ADS] [CrossRef] [Google Scholar]
- Getman, K. V., Feigelson, E. D., Kuhn, M. A., et al. 2014b, ApJ, 787, 108 [Google Scholar]
- Getman, K. V., Feigelson, E. D., Garmire, G. P., et al. 2022, ApJ, 935, 43 [NASA ADS] [CrossRef] [Google Scholar]
- Goicoechea, J. R., Le Bourlot, J., Black, J. H., et al. 2024, A&A, 689, L4 [NASA ADS] [CrossRef] [EDP Sciences] [Google Scholar]
- Gordon, K. 2024, J. Open Source Softw., 9, 7023 [NASA ADS] [CrossRef] [Google Scholar]
- Gordon, K. D., Cartledge, S., & Clayton, G. C. 2009, ApJ, 705, 1320 [NASA ADS] [CrossRef] [Google Scholar]
- Gordon, K. D., Misselt, K. A., Bouwman, J., et al. 2021, ApJ, 916, 33 [NASA ADS] [CrossRef] [Google Scholar]
- Gordon, K. D., Clayton, G. C., Decleir, M., et al. 2023, ApJ, 950, 86 [CrossRef] [Google Scholar]
- Grant, S. L., van Dishoeck, E. F., Tabone, B., et al. 2023, ApJ, 947, L6 [NASA ADS] [CrossRef] [Google Scholar]
- Grant, S. L., Kurtovic, N. T., van Dishoeck, E. F., et al. 2024, A&A, 689, A85 [NASA ADS] [CrossRef] [EDP Sciences] [Google Scholar]
- Guarcello, M. G., Drake, J. J., Wright, N. J., et al. 2023, ApJS, 269, 13 [NASA ADS] [CrossRef] [Google Scholar]
- Güdel, M., Briggs, K. R., Montmerle, T., et al. 2008, Science, 319, 309 [Google Scholar]
- Guerra-Alvarado, O. M., van der Marel, N., Williams, J. P., et al. 2025, A&A, 696, A232 [NASA ADS] [CrossRef] [EDP Sciences] [Google Scholar]
- Gvaramadze, V. V., Kniazev, A. Y., Kroupa, P., & Oh, S. 2011, A&A, 535, A29 [NASA ADS] [CrossRef] [EDP Sciences] [Google Scholar]
- Haworth, T. J., Clarke, C. J., Rahman, W., Winter, A. J., & Facchini, S. 2018, MNRAS, 481, 452 [NASA ADS] [CrossRef] [Google Scholar]
- Haworth, T. J., Coleman, G. A. L., Qiao, L., Sellek, A. D., & Askari, K. 2023, MNRAS, 526, 4315 [NASA ADS] [CrossRef] [Google Scholar]
- Henney, W. J., & O’Dell, C. R. 1999, AJ, 118, 2350 [CrossRef] [Google Scholar]
- Henning, T., Kamp, I., Samland, M., et al. 2024, PASP, 136, 054302 [NASA ADS] [CrossRef] [Google Scholar]
- Herbig, G. H. 1960, ApJS, 4, 337 [Google Scholar]
- Hunter, J. D. 2007, Comput. Sci. Eng., 9, 90 [NASA ADS] [CrossRef] [Google Scholar]
- Husser, T. O., Wende-von Berg, S., Dreizler, S., et al. 2013, A&A, 553, A6 [NASA ADS] [CrossRef] [EDP Sciences] [Google Scholar]
- Johnson, J. A., Aller, K. M., Howard, A. W., & Crepp, J. R. 2010, PASP, 122, 905 [Google Scholar]
- Johnstone, D., Hollenbach, D., & Bally, J. 1998, ApJ, 499, 758 [NASA ADS] [CrossRef] [Google Scholar]
- Joy, A. H. 1945, ApJ, 102, 168 [Google Scholar]
- Juhász, A., Bouwman, J., Henning, T., et al. 2010, ApJ, 721, 431 [Google Scholar]
- Kessler-Silacci, J., Augereau, J.-C., Dullemond, C. P., et al. 2006, ApJ, 639, 275 [NASA ADS] [CrossRef] [Google Scholar]
- Kim, K. H., Watson, D. M., Manoj, P., et al. 2016, ApJS, 226, 8 [Google Scholar]
- King, R. R., Naylor, T., Broos, P. S., Getman, K. V., & Feigelson, E. D. 2013, ApJS, 209, 28 [NASA ADS] [CrossRef] [Google Scholar]
- Kóspál, Á., Ábrahám, P., Diehl, L., et al. 2023, ApJ, 945, L7 [CrossRef] [Google Scholar]
- Kuhn, M. A., Povich, M. S., Luhman, K. L., et al. 2013, ApJS, 209, 29 [NASA ADS] [CrossRef] [Google Scholar]
- Kurucz, R. 1993, Robert Kurucz CD-ROM, 13 [Google Scholar]
- Lagage, P.-O., Doucet, C., Pantin, E., et al. 2006, Science, 314, 621 [Google Scholar]
- Lawrence, A., Warren, S. J., Almaini, O., et al. 2007, MNRAS, 379, 1599 [Google Scholar]
- Lindegren, L., Hernández, J., Bombrun, A., et al. 2018, A&A, 616, A2 [NASA ADS] [CrossRef] [EDP Sciences] [Google Scholar]
- Lindegren, L., Bastian, U., Biermann, M., et al. 2021, A&A, 649, A4 [EDP Sciences] [Google Scholar]
- Lissauer, J. J., Fabrycky, D. C., Ford, E. B., et al. 2011, Nature, 470, 53 [Google Scholar]
- Lommen, D. J. P., van Dishoeck, E. F., Wright, C. M., et al. 2010, A&A, 515, A77 [NASA ADS] [CrossRef] [EDP Sciences] [Google Scholar]
- Lucas, P. W., Hoare, M. G., Longmore, A., et al. 2008, MNRAS, 391, 136 [Google Scholar]
- Maaskant, K. M., Min, M., Waters, L. B. F. M., & Tielens, A. G. G. M. 2014, A&A, 563, A78 [NASA ADS] [CrossRef] [EDP Sciences] [Google Scholar]
- Maíz Apellániz, J., Walborn, N. R., Morrell, N. I., Niemela, V. S., & Nelan, E. P. 2007, ApJ, 660, 1480 [Google Scholar]
- Mandell, A. M., Bast, J., van Dishoeck, E. F., et al. 2012, ApJ, 747, 92 [NASA ADS] [CrossRef] [Google Scholar]
- Massi, F., Giannetti, A., Di Carlo, E., et al. 2015, A&A, 573, A95 [NASA ADS] [CrossRef] [EDP Sciences] [Google Scholar]
- Meeus, G., Waters, L. B. F. M., Bouwman, J., et al. 2001, A&A, 365, 476 [CrossRef] [EDP Sciences] [Google Scholar]
- Miotello, A., Rosotti, G., Ansdell, M., et al. 2021, A&A, 651, A48 [NASA ADS] [CrossRef] [EDP Sciences] [Google Scholar]
- Najita, J. R., Carr, J. S., Pontoppidan, K. M., et al. 2013, ApJ, 766, 134 [Google Scholar]
- Ndugu, N., Bitsch, B., & Lienert, J. L. 2024, A&A, 691, A32 [NASA ADS] [CrossRef] [EDP Sciences] [Google Scholar]
- Nuñez, E. H., Povich, M. S., Binder, B. A., Townsley, L. K., & Broos, P. S. 2021, AJ, 162, 153 [Google Scholar]
- O’dell, C. R., Wen, Z., & Hu, X. 1993, ApJ, 410, 696 [CrossRef] [Google Scholar]
- Parravano, A., Hollenbach, D. J., & McKee, C. F. 2003, ApJ, 584, 797 [Google Scholar]
- Pascucci, I., Apai, D., Luhman, K., et al. 2009, ApJ, 696, 143 [Google Scholar]
- Pascucci, I., Herczeg, G., Carr, J. S., & Bruderer, S. 2013, ApJ, 779, 178 [NASA ADS] [CrossRef] [Google Scholar]
- Perotti, G., Christiaens, V., Henning, T., et al. 2023, Nature, 620, 516 [NASA ADS] [CrossRef] [Google Scholar]
- Pontoppidan, K. M., Salyk, C., Blake, G. A., et al. 2010, ApJ, 720, 887 [CrossRef] [Google Scholar]
- Pontoppidan, K. M., Salyk, C., Banzatti, A., et al. 2024, ApJ, 963, 158 [NASA ADS] [CrossRef] [Google Scholar]
- Portilla-Revelo, B., Getman, K. V., Ramírez-Tannus, M. C., et al. 2025, ApJ, 985, 72 [Google Scholar]
- Povich, M. S., Kuhn, M. A., Getman, K. V., et al. 2013, ApJS, 209, 31 [NASA ADS] [CrossRef] [Google Scholar]
- Povich, M. S., Busk, H. A., Feigelson, E. D., Townsley, L. K., & Kuhn, M. A. 2017, ApJ, 838, 61 [NASA ADS] [CrossRef] [Google Scholar]
- Qiao, L., Coleman, G. A. L., & Haworth, T. J. 2023, MNRAS, 522, 1939 [NASA ADS] [CrossRef] [Google Scholar]
- Ramírez-Tannus, M. C., Poorta, J., Bik, A., et al. 2020, A&A, 633, A155 [NASA ADS] [CrossRef] [EDP Sciences] [Google Scholar]
- Ramirez-Tannus, M. C., Backs, F., Bik, A., et al. 2021, Physics and Chemistry of Planet-Forming Disks in Extreme Radiation Environments, JWST Proposal. Cycle 1, ID. #1759 [Google Scholar]
- Ramírez-Tannus, M. C., Bik, A., Cuijpers, L., et al. 2023, ApJ, 958, L30 [CrossRef] [Google Scholar]
- Richert, A. J. W., Feigelson, E. D., Getman, K. V., & Kuhn, M. A. 2015, ApJ, 811, 10 [NASA ADS] [CrossRef] [Google Scholar]
- Richert, A. J. W., Getman, K. V., Feigelson, E. D., et al. 2018, MNRAS, 477, 5191 [NASA ADS] [CrossRef] [Google Scholar]
- Rieke, G. H., Wright, G. S., Böker, T., et al. 2015, PASP, 127, 584 [NASA ADS] [CrossRef] [Google Scholar]
- Rigby, J., Perrin, M., McElwain, M., et al. 2023, PASP, 135, 048001 [NASA ADS] [CrossRef] [Google Scholar]
- Roccatagliata, V., Bouwman, J., Henning, T., et al. 2011, ApJ, 733, 113 [NASA ADS] [CrossRef] [Google Scholar]
- Rogers, C., Brandl, B., & de Marchi, G. 2025, A&A, 698, A226 [NASA ADS] [CrossRef] [EDP Sciences] [Google Scholar]
- Romero-Mirza, C. E., Öberg, K. I., Banzatti, A., et al. 2024, ApJ, 964, 36 [CrossRef] [Google Scholar]
- Russeil, D., Zavagno, A., Motte, F., et al. 2010, A&A, 515, A55 [CrossRef] [EDP Sciences] [Google Scholar]
- Russeil, D., Zavagno, A., Adami, C., et al. 2012, A&A, 538, A142 [NASA ADS] [CrossRef] [EDP Sciences] [Google Scholar]
- Russeil, D., Adami, C., Bouret, J. C., et al. 2017, A&A, 607, A86 [NASA ADS] [CrossRef] [EDP Sciences] [Google Scholar]
- Salyk, C., Pontoppidan, K. M., Blake, G. A., et al. 2008, ApJ, 676, L49 [NASA ADS] [CrossRef] [Google Scholar]
- Salyk, C., Pontoppidan, K. M., Blake, G. A., Najita, J. R., & Carr, J. S. 2011, ApJ, 731, 130 [Google Scholar]
- Salyk, C., Pontoppidan, K. M., Banzatti, A., et al. 2025, AJ, 169, 184 [Google Scholar]
- Sharples, R., Bender, R., Agudo Berbel, A., et al. 2013, The Messenger, 151, 21 [NASA ADS] [Google Scholar]
- Sicilia-Aguilar, A., Hartmann, L., Calvet, N., et al. 2006, ApJ, 638, 897 [NASA ADS] [CrossRef] [Google Scholar]
- Sicilia-Aguilar, A., Hartmann, L. W., Watson, D., et al. 2007, ApJ, 659, 1637 [Google Scholar]
- Sicilia-Aguilar, A., Kim, J. S., Sobolev, A., et al. 2013, A&A, 559, A3 [NASA ADS] [CrossRef] [EDP Sciences] [Google Scholar]
- Siess, L., Dufour, E., & Forestini, M. 2000, A&A, 358, 593 [Google Scholar]
- Stapper, L. M., Hogerheijde, M. R., van Dishoeck, E. F., & Mentel, R. 2022, A&A, 658, A112 [NASA ADS] [CrossRef] [EDP Sciences] [Google Scholar]
- Stapper, L. M., Hogerheijde, M. R., van Dishoeck, E. F., et al. 2025a, A&A, 693, A49 [NASA ADS] [CrossRef] [EDP Sciences] [Google Scholar]
- Stapper, L. M., Hogerheijde, M. R., van Dishoeck, E. F., et al. 2025b, A&A, 693, A286 [NASA ADS] [CrossRef] [EDP Sciences] [Google Scholar]
- Tabone, B., Bettoni, G., van Dishoeck, E. F., et al. 2023, Nat. Astron., 7, 805 [NASA ADS] [CrossRef] [Google Scholar]
- Temmink, M., van Dishoeck, E. F., Gasman, D., et al. 2024, A&A, 689, A330 [NASA ADS] [CrossRef] [EDP Sciences] [Google Scholar]
- Townsley, L. K., Broos, P. S., Garmire, G. P., et al. 2018, ApJS, 235, 43 [NASA ADS] [CrossRef] [Google Scholar]
- Townsley, L. K., Broos, P. S., Garmire, G. P., & Povich, M. S. 2019, ApJS, 244, 28 [NASA ADS] [CrossRef] [Google Scholar]
- Valegård, P. G., Waters, L. B. F. M., & Dominik, C. 2021, A&A, 652, A133 [NASA ADS] [CrossRef] [EDP Sciences] [Google Scholar]
- van Boekel, R., Min, M., Waters, L. B. F. M., et al. 2005, A&A, 437, 189 [NASA ADS] [CrossRef] [EDP Sciences] [Google Scholar]
- van Breemen, J. M., Min, M., Chiar, J. E., et al. 2011, A&A, 526, A152 [NASA ADS] [CrossRef] [EDP Sciences] [Google Scholar]
- van der Walt, S., Colbert, S. C., & Varoquaux, G. 2011, Comput. Sci. Eng. 13, 22 [Google Scholar]
- van Terwisga, S. E., Hacar, A., & van Dishoeck, E. F. 2019, A&A, 628, A85 [NASA ADS] [CrossRef] [EDP Sciences] [Google Scholar]
- van Terwisga, S. E., van Dishoeck, E. F., Mann, R. K., et al. 2020, A&A, 640, A27 [NASA ADS] [CrossRef] [EDP Sciences] [Google Scholar]
- Virtanen, P., Gommers, R., Burovski, E., et al. 2020, https://doi.org/10.5281/zenodo.4406806 [Google Scholar]
- Vlasblom, M., Temmink, M., Grant, S. L., et al. 2025, A&A, 693, A278 [NASA ADS] [CrossRef] [EDP Sciences] [Google Scholar]
- Walborn, N. R. 2003, IAU Symp., 212, 13 [Google Scholar]
- Wang, J., Townsley, L. K., Feigelson, E. D., et al. 2007, ApJS, 168, 100 [Google Scholar]
- Wells, M., Pel, J. W., Glasse, A., et al. 2015, PASP, 127, 646 [NASA ADS] [CrossRef] [Google Scholar]
- Wenger, M., Ochsenbein, F., Egret, D., et al. 2000, A&AS, 143, 9 [NASA ADS] [CrossRef] [EDP Sciences] [Google Scholar]
- Westmoquette, M. S., Slavin, J. D., Smith, L. J., & Gallagher, III, J. S. 2010, MNRAS, 402, 152 [Google Scholar]
- Wheeler, C. H., Hinkel, N. R., & Banzatti, A. 2024, PASP, 136, 113002 [Google Scholar]
- Winter, A. J., & Haworth, T. J. 2022, Eur. Phys. J. Plus, 137, 1132 [NASA ADS] [CrossRef] [Google Scholar]
- Winter, A. J., Clarke, C. J., Rosotti, G. P., Hacar, A., & Alexander, R. 2019, MNRAS, 490, 5478 [NASA ADS] [CrossRef] [Google Scholar]
- Winter, A. J., Kruijssen, J. M. D., Chevance, M., Keller, B. W., & Longmore, S. N. 2020, MNRAS, 491, 903 [NASA ADS] [CrossRef] [Google Scholar]
- Wright, G. S., Wright, D., Goodson, G. B., et al. 2015, PASP, 127, 595 [NASA ADS] [CrossRef] [Google Scholar]
- Wright, G. S., Rieke, G. H., Glasse, A., et al. 2023, PASP, 135, 048003 [NASA ADS] [CrossRef] [Google Scholar]
- Yoffe, G., van Boekel, R., Li, A., et al. 2023, A&A, 674, A57 [NASA ADS] [CrossRef] [EDP Sciences] [Google Scholar]
- Zannese, M., Tabone, B., Habart, E., et al. 2023, A&A, 671, A41 [NASA ADS] [CrossRef] [EDP Sciences] [Google Scholar]
- Zannese, M., Tabone, B., Habart, E., et al. 2025, A&A, 696, A99 [NASA ADS] [CrossRef] [EDP Sciences] [Google Scholar]
All Tables
All Figures
|
Fig. 1 Color composite image of the massive star-forming region NGC 6357 combining UKIRT Ks-band (blue) with Spitzer-IRAC 4.5 μm (green) and Spitzer-IRAC 8.0 μm (red) data. The small colored points show the location of the XUE sources with respect to the massive stars (Teff > 25 000 K) in the region which are shown with the stars. The color bar indicates the temperature of the massive stars. The white circles show the location of the three subclusters: Pis 24 containing XUE 1, 2, 3, and 4, G353.1+0.6 containing XUE 5, 6, 7, and 8, and G353.1+0.7 containing XUE 9, 10, 11, and 12. |
| In the text | |
|
Fig. 2 FUV flux experienced by our targets with respect to their projected separation to ionizing sources in each NGC 6357 subregion. The full and empty symbols show the primary and secondary ionizing stars in each subregion. The names of the sources are displayed on the markers and are visible when zooming in. |
| In the text | |
|
Fig. 3 Spectral energy distributions of the XUE sources. Each column shows the sources in one region: Pis 24, G353.1+0.6, and G353.1+0.7 from left to right. The light colors show the observed data; the dark ones show the dereddened data. The panels in the top of each subfigure show the MRS data cube at 5.5 μm. |
| In the text | |
|
Fig. 4 Overview of the spectral region between 13.2 and 16 μm for all XUE sources. The lowermost spectrum shows the most prominent molecules in this region: HCN at 400 K and 1016 cm−2 (dark green), H2O at 400 K and 2.2 × 1016 cm−2 (magenta), C2H2 at 400 K and 2.2 × 1016 cm−2 (light green), CO2 at 400 K and 1016 cm−2 (red), H2O at 850 K and 1018 cm−2 (blue), and 13CO2 400 K and 1016 cm−2 (dark red). |
| In the text | |
|
Fig. 5 10 μm silicate feature for the XUE sources. The features are continuum subtracted and normalized to the maximum value. The thick solid lines show the smoothed spectra and the thin lines the MIRI observations. The dashed lines mark 9.8 and 11.3 μm and the dot on top of each feature shows the position of the maximum flux. |
| In the text | |
|
Fig. 6 Silicate 10 μm feature strength versus shape. The purple triangles show the Herbig AeBe sources from van Boekel et al. (2005), the gray diamonds show the sample of T-Tauri and Herbig-Ae/Be stars from Lommen et al. (2010), the black stars show the Herbig AeBe sources from Juhász et al. (2010), and the colored squares show the XUE sources. |
| In the text | |
|
Fig. 7 Comparison with a sample of disks with masses >2 M⊙ in Orion (Kim et al. 2016). The top panels show the external FUV flux as a function of each spectral index, the XUE sources are shown with the colored dots and Kim et al. (2016) data with the gray crosses. The bottom panels show the empirical cumulative distribution functions for each index, the p values listed are the result of a Kolmogorov-Smirnov test. |
| In the text | |
|
Fig. 8 Comparison between the 17 μm H2O luminosity and the spectral index n13–25 (left), the stellar mass (middle) and the stellar luminosity (right) of the XUE disks with the Spitzer sample studied by Banzatti et al. (2020) shown with black squares (M < 2 M⊙) and blue pentagons (M > 2 M⊙) and the MIRI observations of nearby disks from the MINDS collaboration (Gasman et al. 2025). The measurements for the XUE spectra are shown with the colored circles, following the same color scheme as the rest of the paper with arrows showing the upper limits. The upper limits from Banzatti et al. (2020) are indicated with gray arrows. The MINDS sources are shown as magenta diamonds. |
| In the text | |
|
Fig. A.1 Gaia DR3 parallaxes of our sources in comparison to those of the O stars in the region (gray). The vertical thick and thin lines correspond to the 1σ and 3σ uncertainty in the parallax measurement. The horizontal black line shows the parallax at 1/1.663 mas corresponding to our determined mean distance and the dashed black lines show the parallax of the interval at [1/1.763, 1/1.563] mas. |
| In the text | |
|
Fig. A.2 Characteristics of XUE stars. In all panels, XUE stars are color-coded and labeled for clarity. The Orion Nebula young stars are represented by blue plus symbols, and NGC 6357 young stars are shown as gray crosses (Getman et al. 2005; Broos et al. 2013; King et al. 2013; Townsley et al. 2019; Getman et al. 2022). (a, b) UKIRT/VVV NIR color-magnitude and color-color diagrams. PARSEC 1.2S PMS isochrones for 0.7 and 2 Myr are shown as solid and dashed curves, respectively. Reddening vectors corresponding to AV = 10 mag are drawn as solid and dashed lines, originating from G0 stars at 0.7 Myr and F0 stars at 2 Myr. (c) Spitzer-IRAC MIR color-color diagram of NGC 6357 young stars with known IRAC photometry. Gray squares represent known disky stars, while purple circles indicate diskless stars (Povich et al. 2013). (d) Absolute K-band magnitude (uncorrected for extinction) as a function of stellar mass. (e) Intrinsic X-ray luminosity as a function of stellar mass. (f) X-ray column density plotted against visual-band extinction. The names of the sources are displayed on the markers and are visible when zooming in. |
| In the text | |
|
Fig. B.1 Spectral energy distributions of the XUE sources. Each column shows the sources in one region: Pis 24, G353.1+0.6 and G353.1+0.7 from left to right. The dashed lines show Phoenix (Brott & Hauschildt 2005) and Kurucz (Kurucz 1993) stellar photospheres with the parameters derived in Section A.2. The dots show UKIRT and IRAC photometry, with the exception of XUE 10 in which VISTA photometry is displayed. The solid line shows the MIRI MRS spectrum. The light colors show the observed data, the dark ones show the dereddened data. The panels in the top-left of each subfigure show the MRS data cube at 5.5 μm. |
| In the text | |
|
Fig. C.1 Overview of the spectral region between 4.9 and 5.3 μm for all XUE sources. The lowermost spectrum shows the most prominent molecules in this region; CO at a temperature of 1500 K and a column density of 3×1017 cm−2 (yellow) and H2O at 850 K and 1018 cm−2 (blue). |
| In the text | |
|
Fig. C.2 Same as Figure C.1 but for the region between 6.5 and 6.9 μm. The lowermost spectrum shows H2O at 850 K and 1018 cm−2 (blue). |
| In the text | |
|
Fig. C.3 Same as Figure C.1 but for the region between 15.8 and 17 μm. The lowermost spectrum shows OH at 600 K and 1016 cm−2 (green). |
| In the text | |
|
Fig. C.4 Same as Figure C.1 but for the region between 23.2 and 24.3 μm. The lowermost spectrum shows warm and hot H2O at 400 K and 2.2 × 1016 cm−2 (blue) and at 900 K and 2.2 × 1016 cm−2 (purple). |
| In the text | |
|
Fig. E.1 Water emission at 17 μm for the XUE sources. For XUE 2, 3, 4, 5, 9, and 10 it was not possible to significantly detect the water lines, we therefore report only upper limits. The vertical lines show the location of three well-separated emission features at 17.101 μm, 17.223 μm, and 17.356 μm. |
| In the text | |
Current usage metrics show cumulative count of Article Views (full-text article views including HTML views, PDF and ePub downloads, according to the available data) and Abstracts Views on Vision4Press platform.
Data correspond to usage on the plateform after 2015. The current usage metrics is available 48-96 hours after online publication and is updated daily on week days.
Initial download of the metrics may take a while.