Open Access
Fig. 2
Download original image
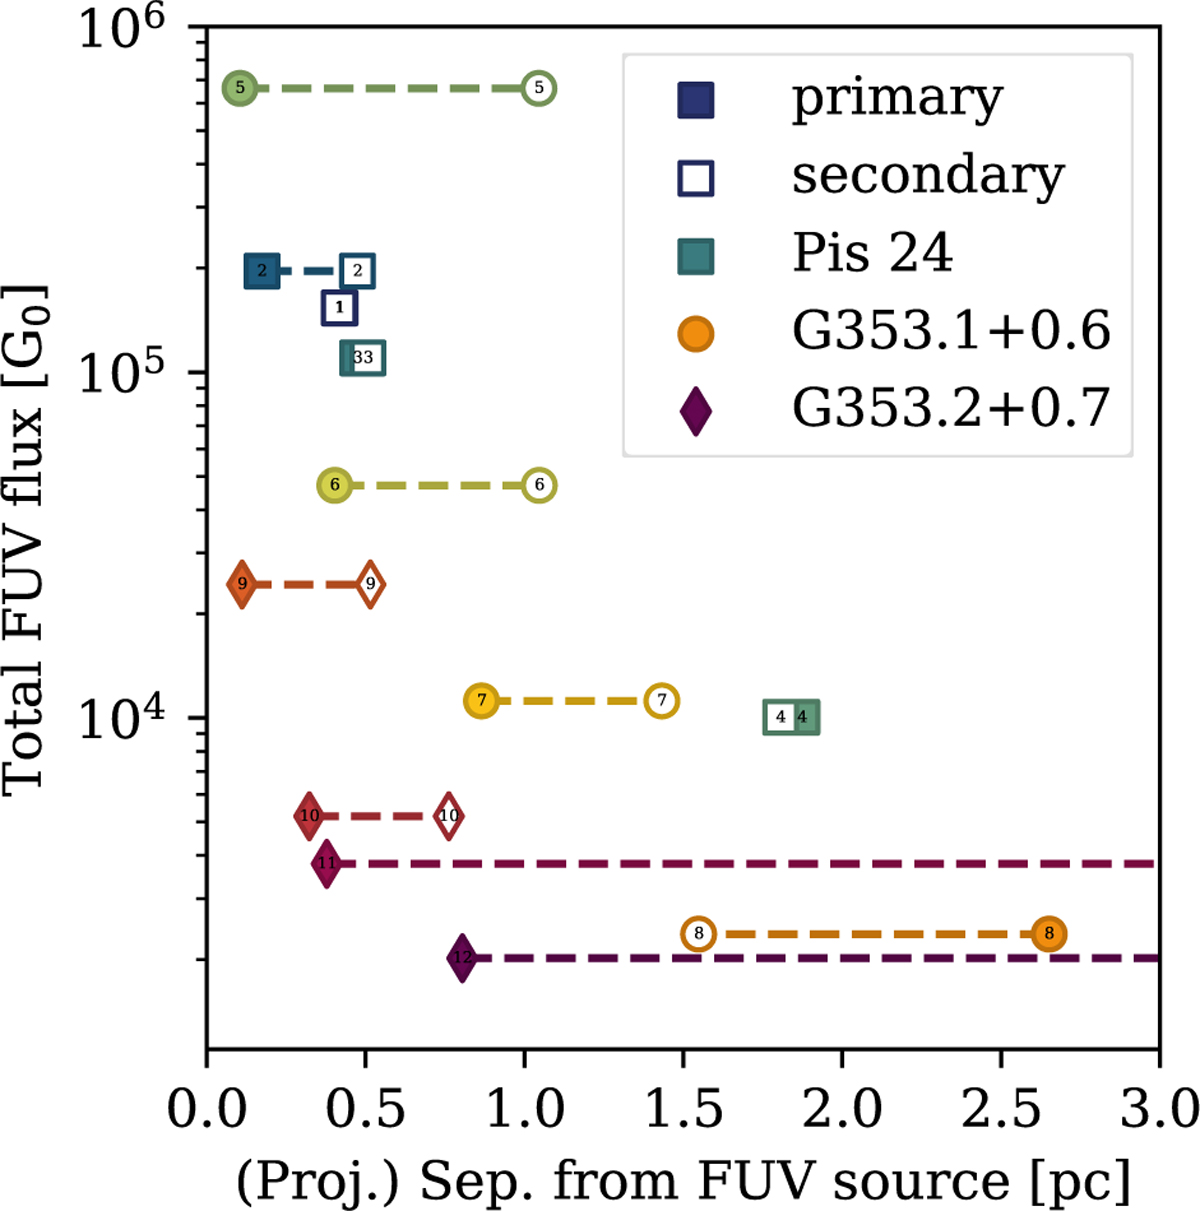
FUV flux experienced by our targets with respect to their projected separation to ionizing sources in each NGC 6357 subregion. The full and empty symbols show the primary and secondary ionizing stars in each subregion. The names of the sources are displayed on the markers and are visible when zooming in.
Current usage metrics show cumulative count of Article Views (full-text article views including HTML views, PDF and ePub downloads, according to the available data) and Abstracts Views on Vision4Press platform.
Data correspond to usage on the plateform after 2015. The current usage metrics is available 48-96 hours after online publication and is updated daily on week days.
Initial download of the metrics may take a while.