Open Access
Fig. 5
Download original image
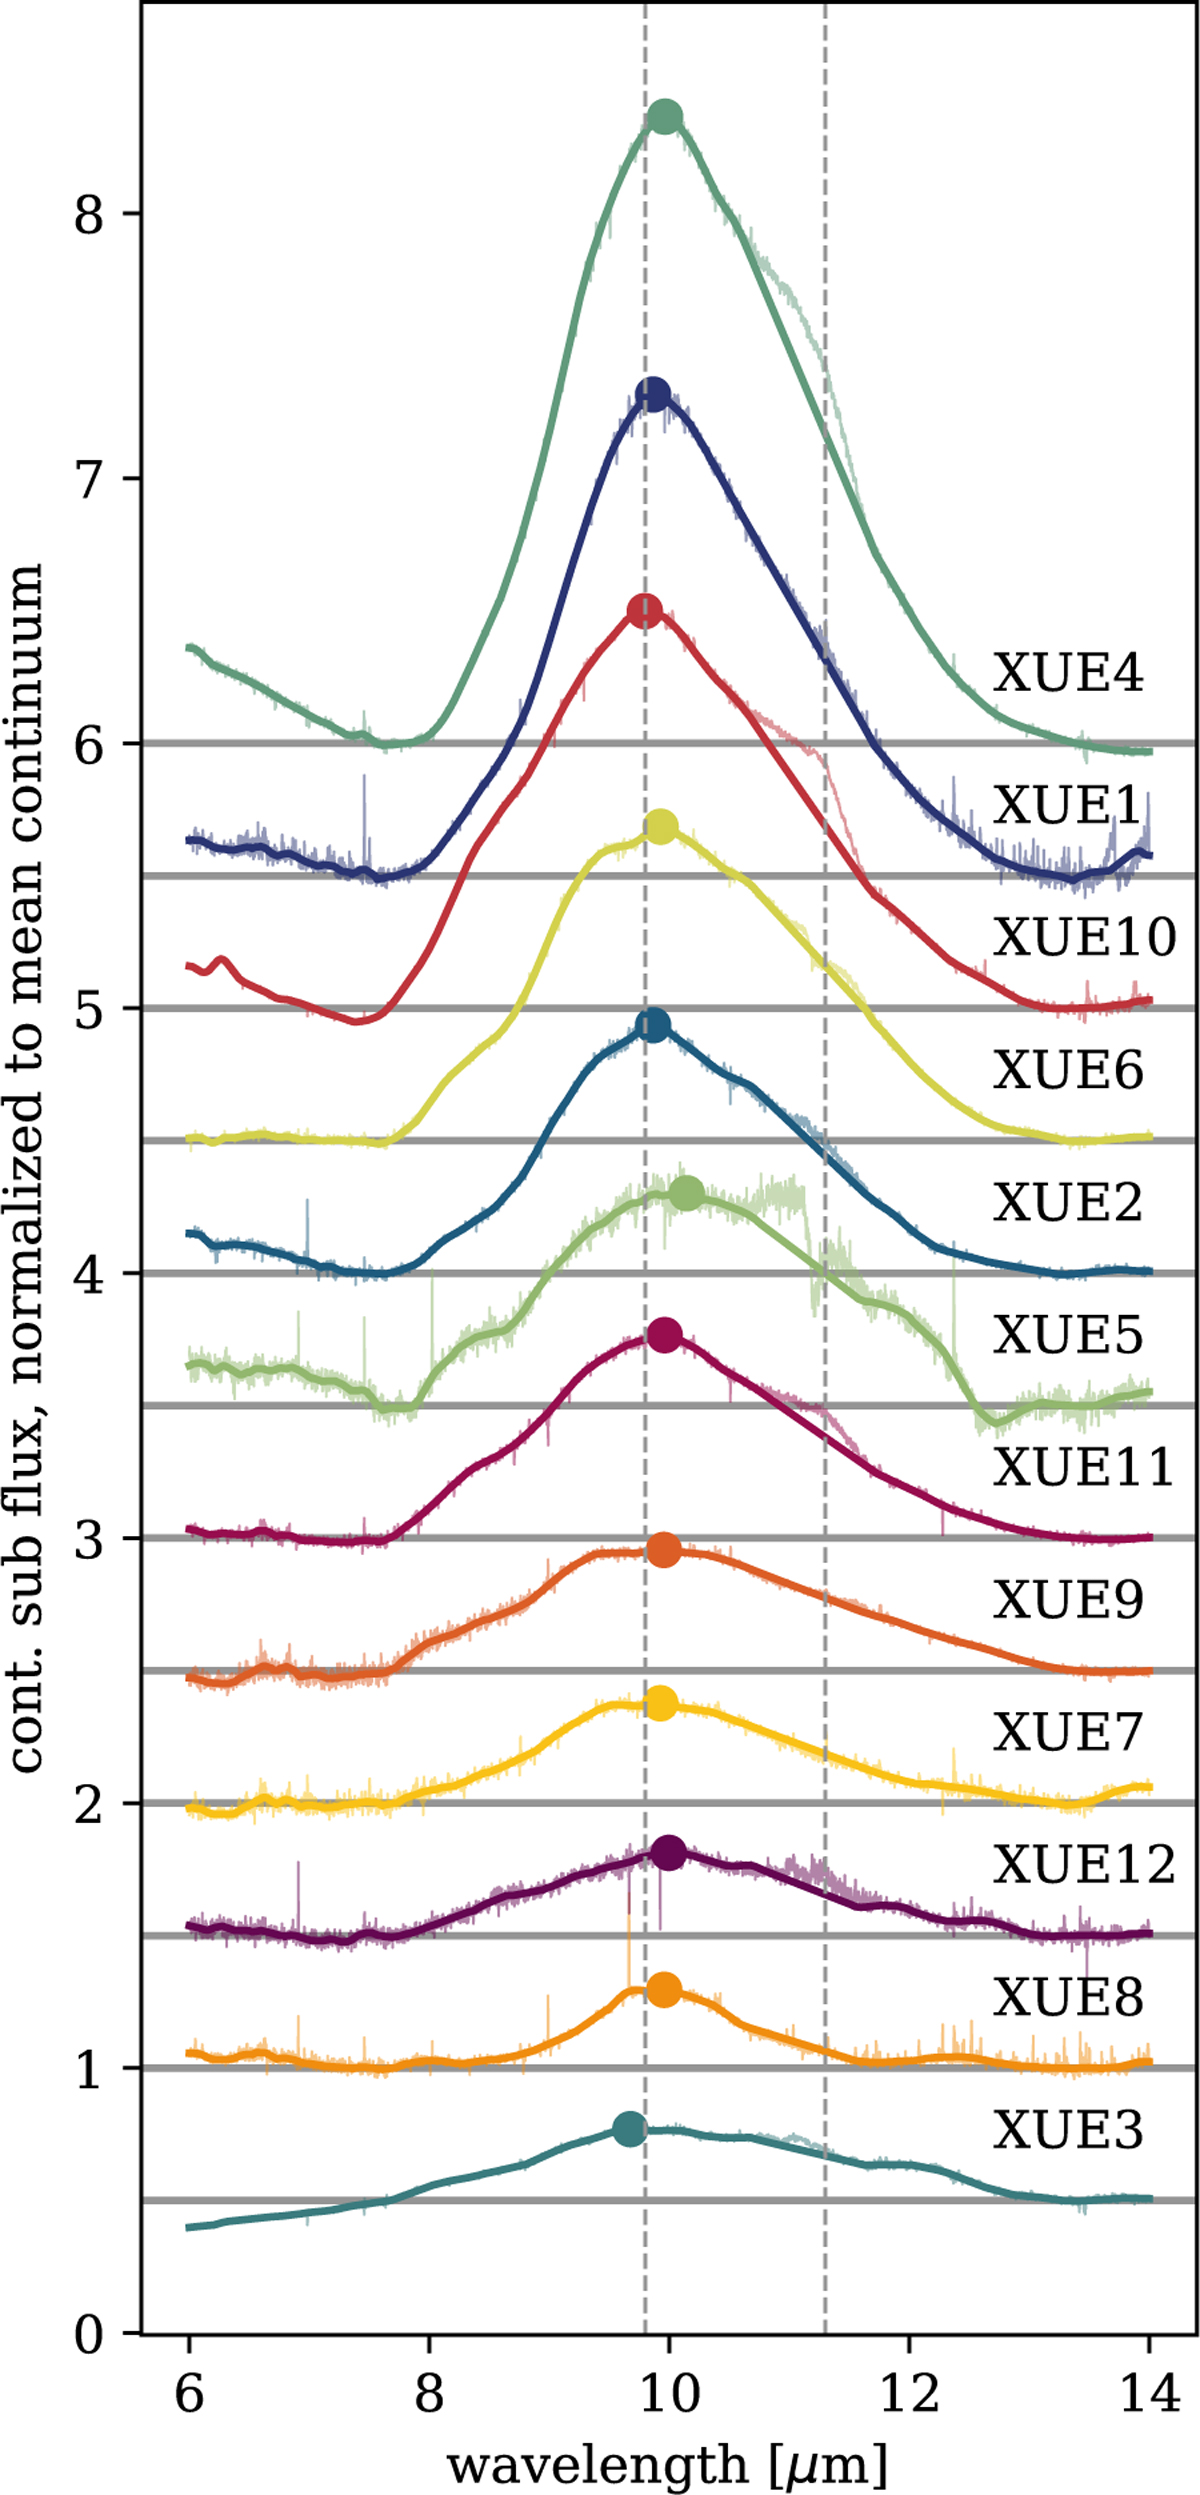
10 μm silicate feature for the XUE sources. The features are continuum subtracted and normalized to the maximum value. The thick solid lines show the smoothed spectra and the thin lines the MIRI observations. The dashed lines mark 9.8 and 11.3 μm and the dot on top of each feature shows the position of the maximum flux.
Current usage metrics show cumulative count of Article Views (full-text article views including HTML views, PDF and ePub downloads, according to the available data) and Abstracts Views on Vision4Press platform.
Data correspond to usage on the plateform after 2015. The current usage metrics is available 48-96 hours after online publication and is updated daily on week days.
Initial download of the metrics may take a while.