Fig. 7
Download original image
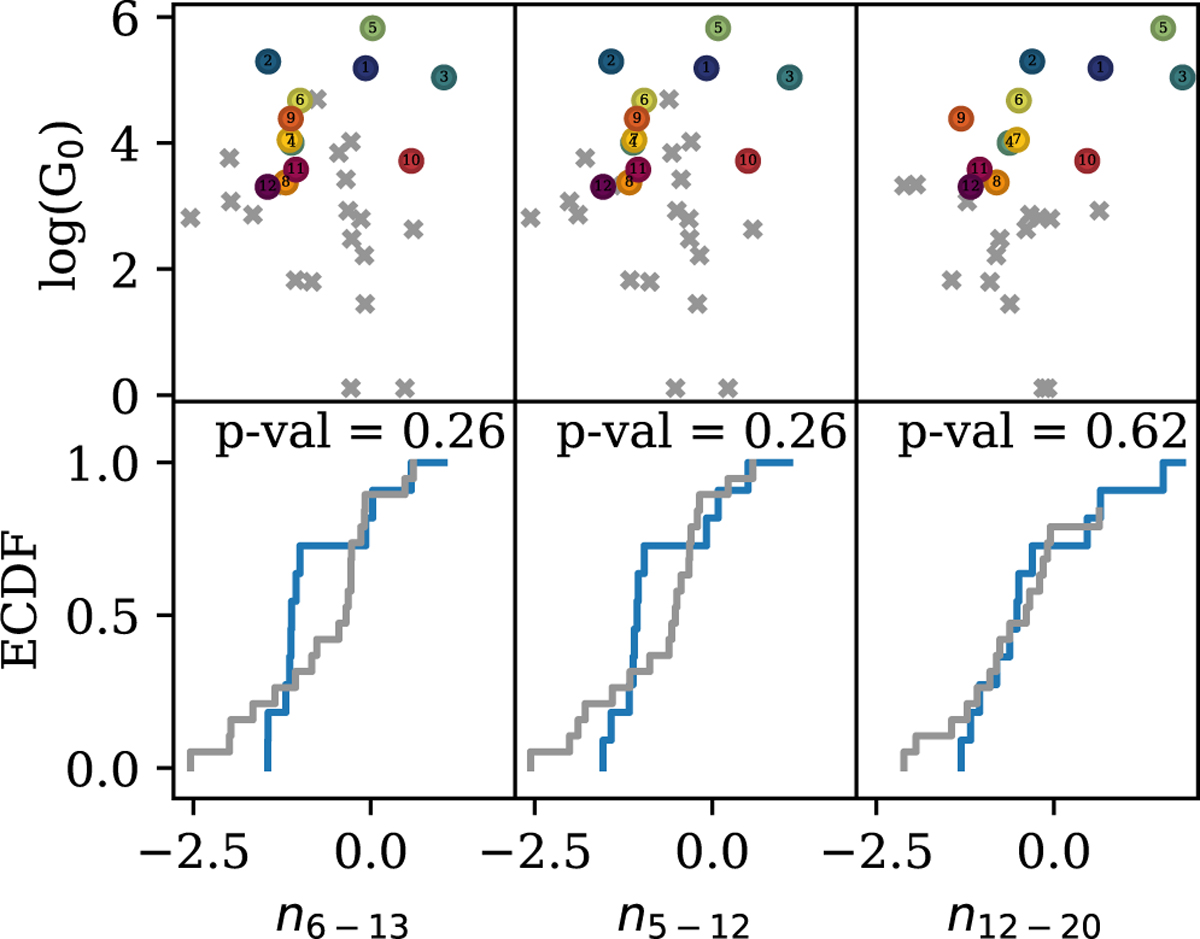
Comparison with a sample of disks with masses >2 M⊙ in Orion (Kim et al. 2016). The top panels show the external FUV flux as a function of each spectral index, the XUE sources are shown with the colored dots and Kim et al. (2016) data with the gray crosses. The bottom panels show the empirical cumulative distribution functions for each index, the p values listed are the result of a Kolmogorov-Smirnov test.
Current usage metrics show cumulative count of Article Views (full-text article views including HTML views, PDF and ePub downloads, according to the available data) and Abstracts Views on Vision4Press platform.
Data correspond to usage on the plateform after 2015. The current usage metrics is available 48-96 hours after online publication and is updated daily on week days.
Initial download of the metrics may take a while.