Fig. 1.
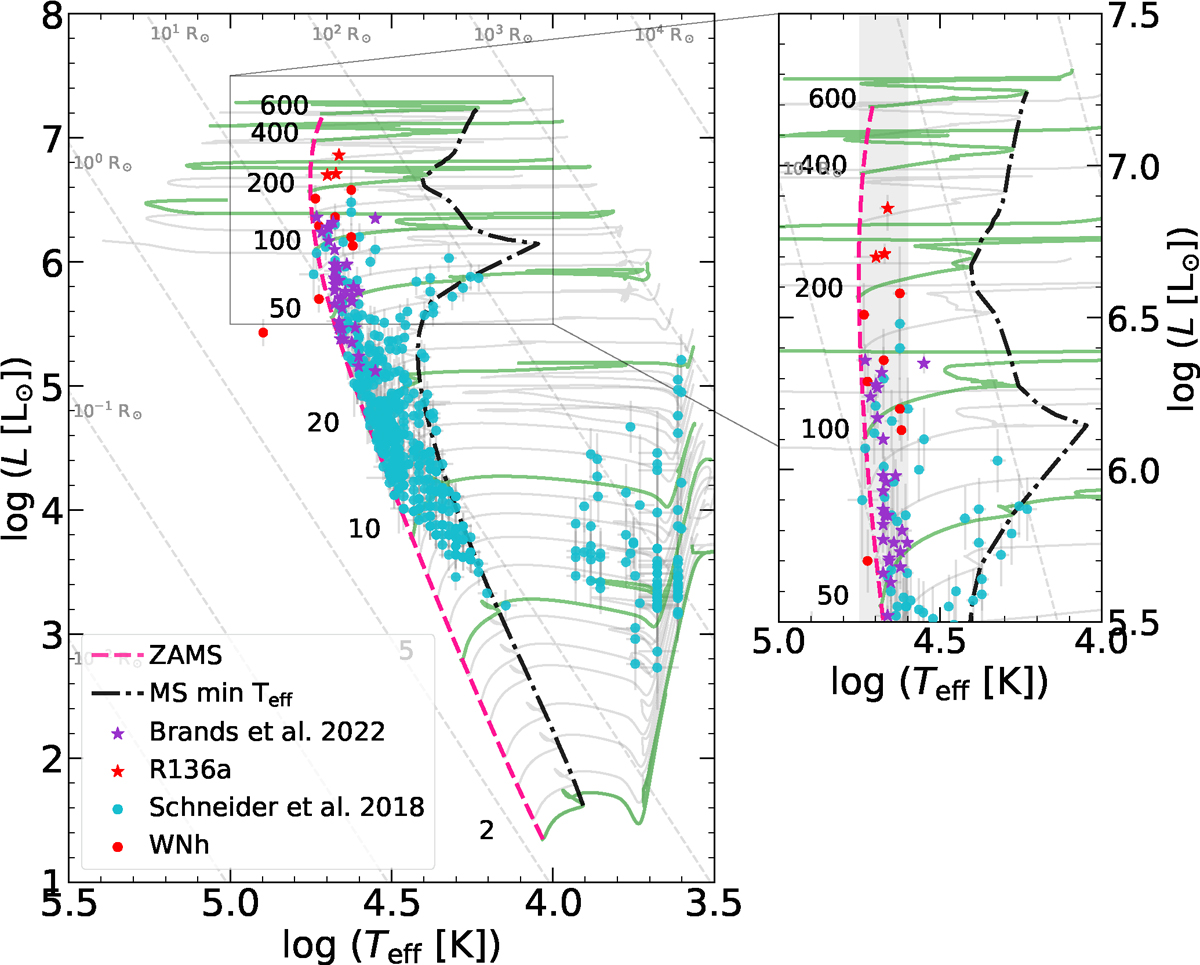
Download original image
Hertzsprung-Russel diagram adapted from Costa et al. (2025) showing stars in the LMC. The green and gray lines show tracks from Costa et al. (2025), that were computed with Z = 0.006 and the standard mass-loss rate. The purple and red stars show objects from B22 (red stars indicate R136a), and the blue and red dots are taken from Schneider et al. (2018) (red dots are WNh stars). The dashed pink line and dash-dotted black line show the ZAMS and TAMS, respectively. The zoomed-in plot shows the most massive stars, and the gray shaded region shows the width of the observed temperature range of VMSs in the LMC.
Current usage metrics show cumulative count of Article Views (full-text article views including HTML views, PDF and ePub downloads, according to the available data) and Abstracts Views on Vision4Press platform.
Data correspond to usage on the plateform after 2015. The current usage metrics is available 48-96 hours after online publication and is updated daily on week days.
Initial download of the metrics may take a while.