Fig. 11.
Download original image
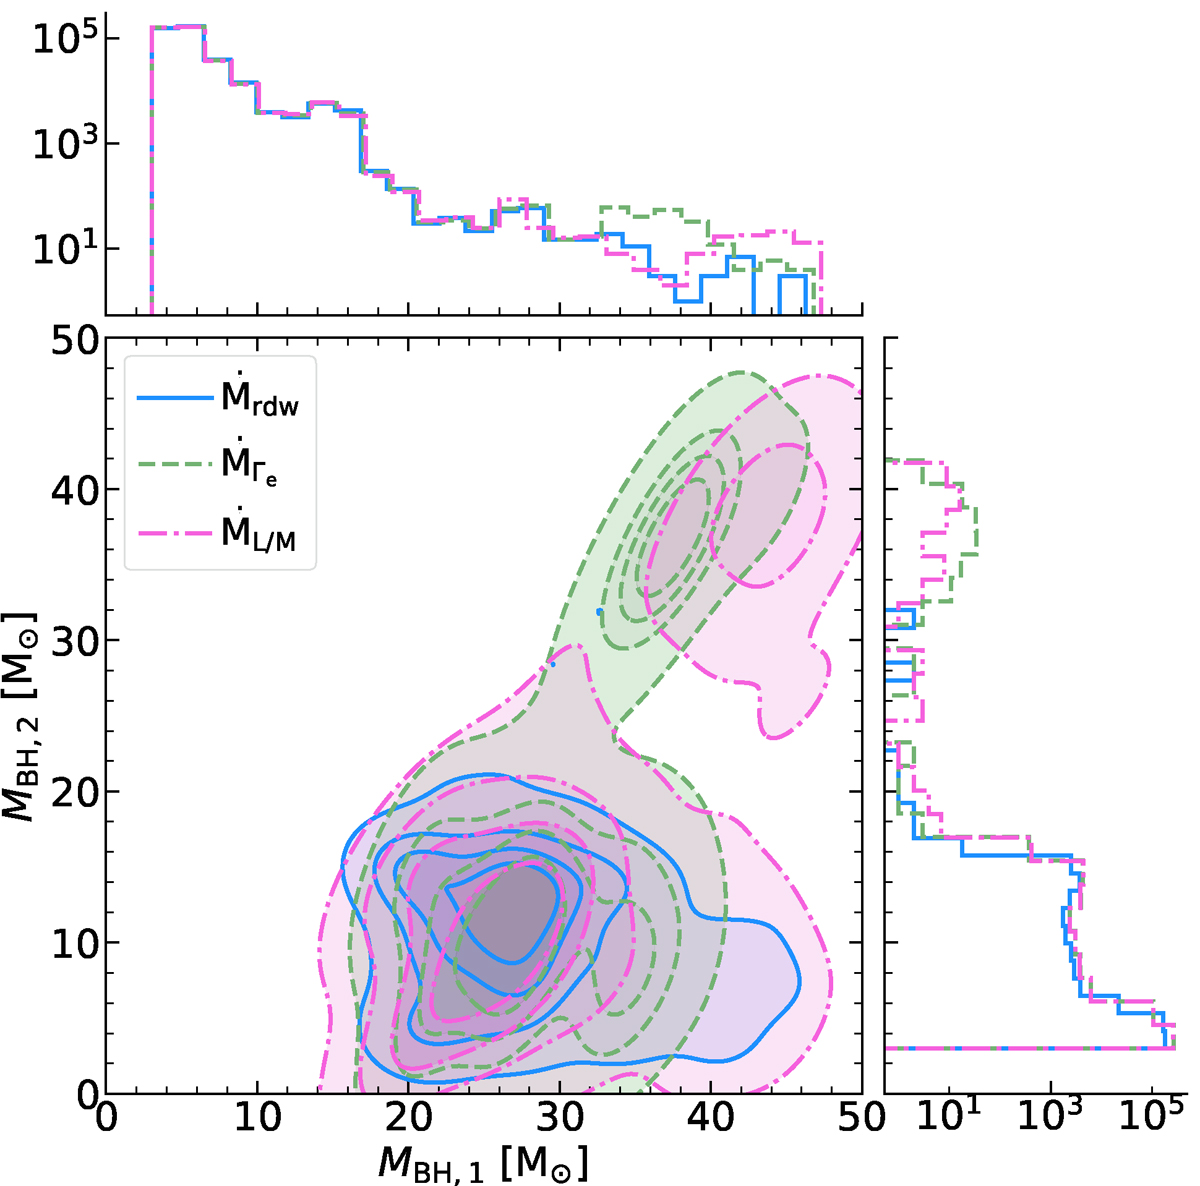
Primary vs. secondary BH masses for BBHs that merge in a Hubble time. The contour plot shows the mergers for binaries with MBH, 1 ≥ 20 M⊙, while the distributions show the full mass range of primary and secondary BH masses on the top and right. The solid blue, dashed green, and dash-dotted pink lines refer to simulations with stellar tracks computed with the Ṁrdw, ṀΓe, and ṀL/M rates, respectively.
Current usage metrics show cumulative count of Article Views (full-text article views including HTML views, PDF and ePub downloads, according to the available data) and Abstracts Views on Vision4Press platform.
Data correspond to usage on the plateform after 2015. The current usage metrics is available 48-96 hours after online publication and is updated daily on week days.
Initial download of the metrics may take a while.