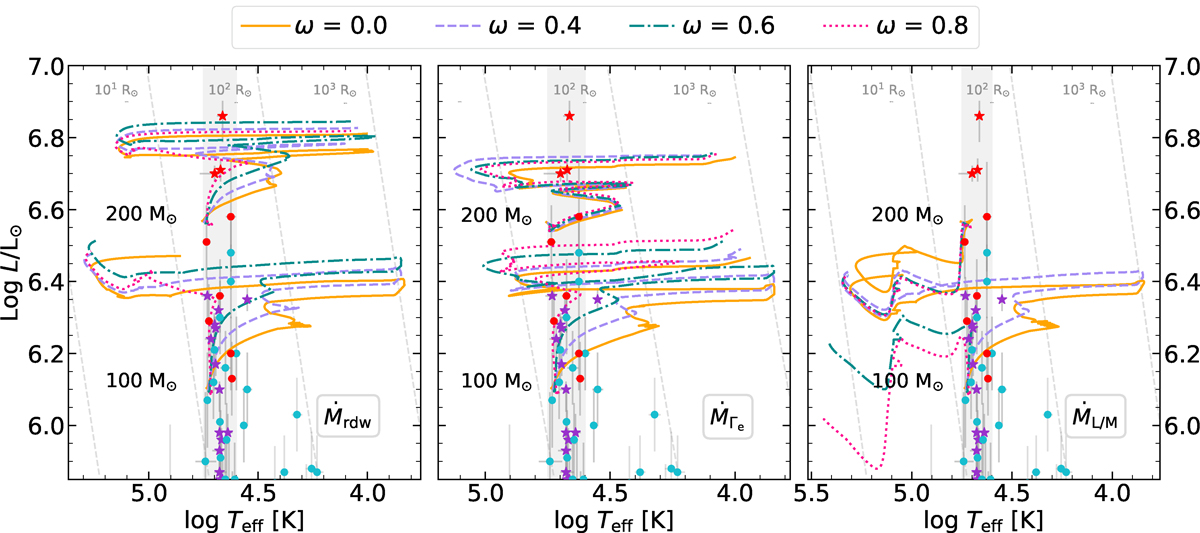
Fig. B.1.
Download original image
HRD for the different rotation rates as indicated by line color and style. The left, center, and right panels refer to the Ṁrdw, ṀΓe, and ṀL/M rates, respectively. The gray-shaded region indicates the observed temperature range in the Tarantula Nebula. Data of stars in 30 Doradus are shown in colored symbols, following the same notation as Figure 1.
Current usage metrics show cumulative count of Article Views (full-text article views including HTML views, PDF and ePub downloads, according to the available data) and Abstracts Views on Vision4Press platform.
Data correspond to usage on the plateform after 2015. The current usage metrics is available 48-96 hours after online publication and is updated daily on week days.
Initial download of the metrics may take a while.