Fig. 2.
Download original image
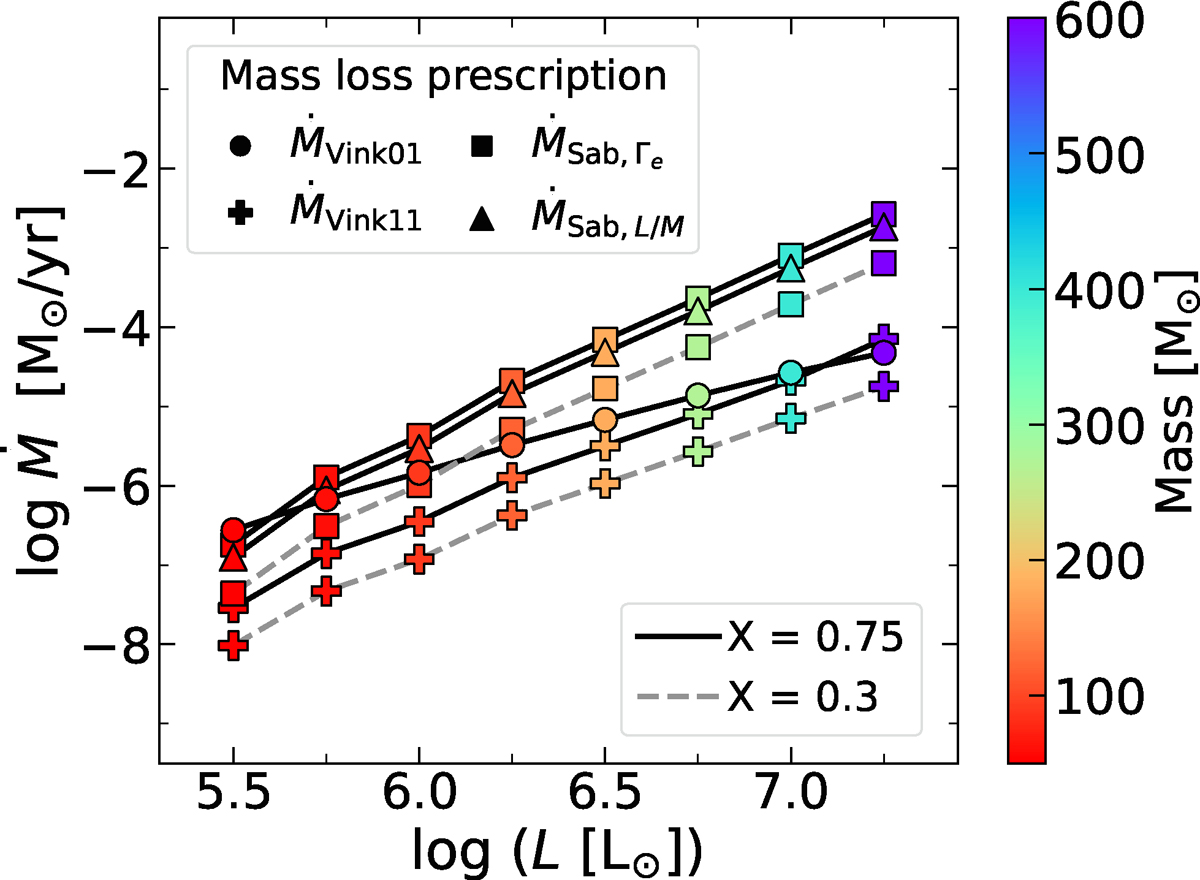
Mass-loss rates predicted for different prescriptions as a function of the mass and luminosity for two ![]() values, indicated in solid black and dashed gray. The color indicates the ZAMS mass corresponding to the ZAMS luminosity. The circle and cross markers show predictions based on Vink et al. (2001, 2011), respectively, and the square and triangle refer to predictions from Sabhahit et al. (2022). The values were computed with a fixed log Teff = 4.8, Z = 0.006, and ν∞ = 2550 km/s.
values, indicated in solid black and dashed gray. The color indicates the ZAMS mass corresponding to the ZAMS luminosity. The circle and cross markers show predictions based on Vink et al. (2001, 2011), respectively, and the square and triangle refer to predictions from Sabhahit et al. (2022). The values were computed with a fixed log Teff = 4.8, Z = 0.006, and ν∞ = 2550 km/s.
Current usage metrics show cumulative count of Article Views (full-text article views including HTML views, PDF and ePub downloads, according to the available data) and Abstracts Views on Vision4Press platform.
Data correspond to usage on the plateform after 2015. The current usage metrics is available 48-96 hours after online publication and is updated daily on week days.
Initial download of the metrics may take a while.