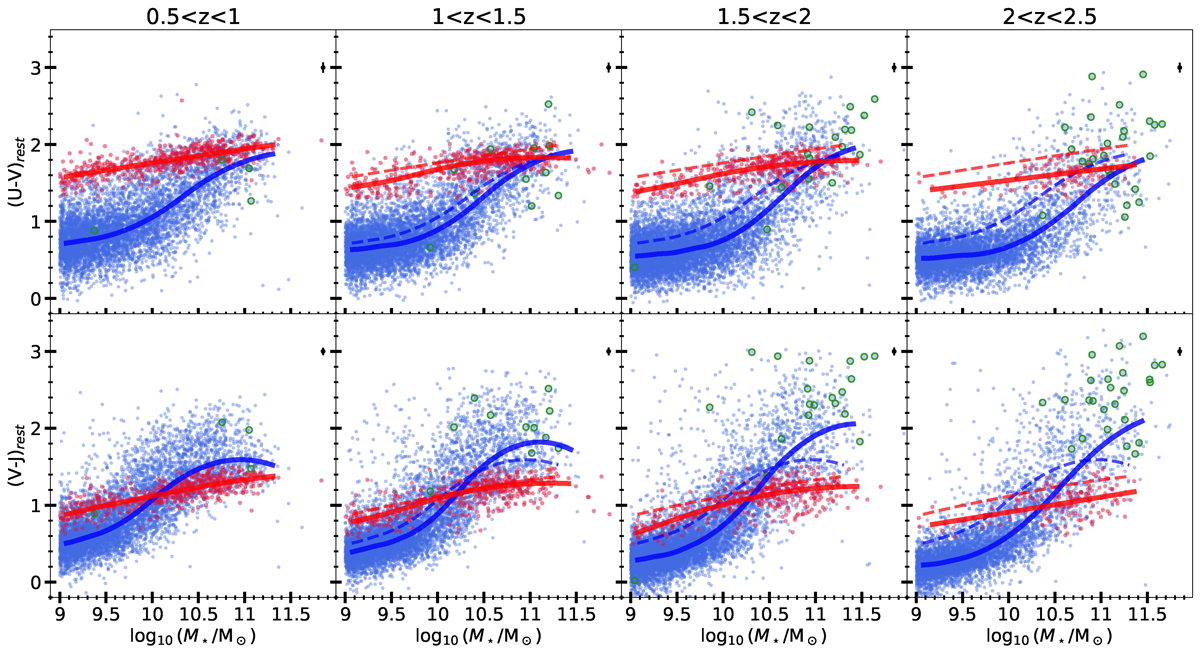
Fig. 1.
Download original image
Rest-frame U − V (upper panels) and V − J (lower panels) colors vs. stellar mass in four redshift bins. Star-forming galaxies are shown in blue and quiescent in red, separated by their location in the V − J vs. U − V color-color diagram as defined by Muzzin et al. (2013) and shown here in Fig. 2. Solid lines are running medians, calculated with a spline-quantile regression (COBS library; Ng & Maechler 2007, 2022). The dashed lines show the running median lines from the 0.5 < z < 1 (leftmost) panels. Green circles indicate submillimeter-detected galaxies. The error bars in the top-right corner of each panel show the median random uncertainty on the rest-frame colors, including the measurement uncertainty of the observed fluxes and the propagated uncertainties from the SED fit.
Current usage metrics show cumulative count of Article Views (full-text article views including HTML views, PDF and ePub downloads, according to the available data) and Abstracts Views on Vision4Press platform.
Data correspond to usage on the plateform after 2015. The current usage metrics is available 48-96 hours after online publication and is updated daily on week days.
Initial download of the metrics may take a while.