| Issue |
A&A
Volume 701, September 2025
|
|
|---|---|---|
| Article Number | A30 | |
| Number of page(s) | 6 | |
| Section | Extragalactic astronomy | |
| DOI | https://doi.org/10.1051/0004-6361/202555488 | |
| Published online | 02 September 2025 | |
Even redder than we knew: Color and AV evolution up to z = 2.5 from JWST/NIRCam photometry
1
Sterrenkundig Observatorium, Universiteit Gent, Krijgslaan 281 S9, 9000 Gent, Belgium
2
Physics and Astronomy Department, Tufts University, 574 Boston Avenue, Medford, MA, 02155, USA
3
Department of Physics, University of Bath, Claverton Down, Bath, BA2 7AY, UK
4
Department of Astronomy, University of Michigan, 1085 South University Avenue, Ann Arbor, MI, 48109–1107, USA
5
Cosmic Dawn Center (DAWN), Niels Bohr Institute, University of Copenhagen, Jagtvej 128, Kóbenhavn N, Copenhagen, DK-2200, Denmark
6
Department of Astronomy, University of Massachusetts, Amherst, MA, 01003, USA
7
Department of Physics and Astronomy and PITT PACC, University of Pittsburgh, Pittsburgh, PA, 15260, USA
8
Department for Astrophysical and Planetary Science, University of Colorado, Boulder, CO, 80309, USA
9
University of Kansas, Department of Physics and Astronomy, 1251 Wescoe Hall Drive, Room 1082, Lawrence, KS, 66049, USA
10
Leiden Observatory, Leiden University, P.O. Box 9513, NL-2300 AA Leiden, The Netherlands
11
Department of Astronomy & Astrophysics, The Pennsylvania State University, University Park, PA, 16802, USA
12
Institute for Computational & Data Sciences, The Pennsylvania State University, University Park, PA, 16802, USA
13
Institute for Gravitation and the Cosmos, The Pennsylvania State University, University Park, PA, 16802, USA
14
Institute for Astronomy, University of Edinburgh, Royal Observatory, Edinburgh, EH9 3HJ, UK
15
Department of Physics, University of California, Santa Barbara, Santa Barbara, CA, 93109, USA
16
Department of Astronomy, The University of Texas at Austin, Austin, TX, USA
17
Laboratory for Multiwavelength Astrophysics, School of Physics and Astronomy, Rochester Institute of Technology, 84 Lomb Memorial Drive, Rochester, NY, 14623, USA
⋆ Corresponding author: This email address is being protected from spambots. You need JavaScript enabled to view it.
Received:
12
May
2025
Accepted:
30
June
2025
Abstract
Aims. JWST/NIRCam provides rest-frame near-IR photometry of galaxies up to z = 2.5 with exquisite depth and accuracy. This affords us an unprecedented view of the evolution of the UV/optical/near-IR color distribution and its interpretation in terms of the evolving dust attenuation, AV.
Methods. We used the value-added data products (photometric redshift, stellar mass, rest-frame U − V and V − J colors, and AV) provided by the public DAWN JWST Archive. These data products derive from fitting the spectral energy distributions obtained from multiple NIRCam imaging surveys, augmented with preexisting HST imaging data. Our sample consists of a stellar-mass-complete sample of ≈28 000M⋆ > 109 M⊙ galaxies in the redshift range 0.5 < z < 2.5.
Results. The V − J color distribution of star-forming galaxies evolves strongly, in particular for high-mass galaxies (M⋆ > 3 × 10¹⁰ M⊙), which have a pronounced tail of very red galaxies reaching V − J > 2.5 at z > 1.5 that does not exist at z < 1. Such red V − J can only be explained by dust attenuation, with typical values for M⋆ ≈ 1011 M⊙ galaxies in the range AV ≈ 1.5 − 3.5 at z ≈ 2. This redshift evolution went largely unnoticed before. Today, however, photometric redshift estimates for the reddest (V − J > 2.5), most attenuated galaxies have markedly improved thanks to the new, precise photometry, which is in much better agreement with the 25 available spectroscopic redshifts for such galaxies. The reddest population readily stands out as the independently identified population of galaxies detected at submillimeter wavelengths. Despite the increased attenuation, U − V colors across the entire mass range are slightly bluer at higher z. A well-defined and tight color sequence exists at redshifts 0.5 < z < 2.5 for M⋆ > 3 × 10¹⁰ M⊙ quiescent galaxies, in both U − V and V − J, but in V − J it is bluer rather than redder compared to star-forming galaxies. In conclusion, whereas the rest-frame UV-optical color distribution evolves remarkably little from z = 0.5 to z = 2.5, the rest-frame optical/near-IR color distribution evolves strongly, primarily due to a very substantial increase with redshift in dust attenuation for massive galaxies.
Key words: galaxies: evolution / galaxies: fundamental parameters / galaxies: general / galaxies: high-redshift / galaxies: photometry / galaxies: statistics
© The Authors 2025
 Open Access article, published by EDP Sciences, under the terms of the Creative Commons Attribution License (https://creativecommons.org/licenses/by/4.0), which permits unrestricted use, distribution, and reproduction in any medium, provided the original work is properly cited.
This article is published in open access under the Subscribe to Open model. This email address is being protected from spambots. You need JavaScript enabled to view it. to support open access publication.
1. Introduction
UV/optical color-magnitude and color-mass diagrams of galaxies have long been used as a descriptive tool to understand the distribution of galaxy properties and their evolution with cosmic time. Holmberg (1950) was the first to note the overall correlation between color and galaxy type. Pettit (1954), Baum (1959), and de Vaucouleurs (1961) demonstrated a correlation between color and luminosity. These fundamental results serve as a precursor of the concept of a “red sequence”, a term coined by Gladders et al. (1998), who were inspired by the key insight that the optical color-magnitude relation for early-type galaxies is universal and extremely tight, with < 0.1 mag scatter (Bower et al. 1992). A red sequence was also found, with a similarly small scatter, in clusters at a large look-back time (z ≲ 1; Ellis et al. 1997; Stanford et al. 1998; Gladders et al. 1998), a discovery made possible by the newly available precise, stable, and deep photometry afforded by the Hubble Space Telescope (HST).
Up until that point, attempts to determine the evolution of the red sequence mostly focused on massive ellipticals and galaxy clusters, and the mainstream view was that red galaxies constitute a passively evolving population that formed at very early cosmic times. But deep, wide-area surveys would soon lead to a paradigm shift. The terminology – the red sequence and its counterpart, the “blue cloud” (first mentioned in Phleps et al. 2006) – was used in seminal studies in the mid-2000s to effectively communicate the key new insight that since at least z ≈ 1 there has been a population of galaxies with low star-formation activity – for which the small range in color is set by the slowly evolving colors of an old stellar population – and a more actively star-forming population, the colors of which vary by larger amounts due to young stars and dust attenuation by dust (Blanton et al. 2003; Bell et al. 2004b,a; Faber et al. 2007; Brown et al. 2007). Arguably the most important aspect of the paradigm shift is that the number density of red-sequence galaxies has grown by a factor of ≈2 since z = 1 (Bell et al. 2004b). This population does not evolve passively. Many of the progenitors of present-day red-sequence galaxies must have been actively forming stars at z ≲ 1 (hence the term “progenitor bias”; van Dokkum & Franx 1996) and, in the meantime, joined the red sequence by ceasing this star-forming activity through some process or combination of processes now commonly referred to under the umbrella of quenching (as in, e.g., Faber et al. 2007)1. Add to this the discovery of the substantial structural evolution of red galaxies (e.g., van der Wel et al. 2008; van Dokkum et al. 2008 and the paradigm shift is complete: there is no passive evolution of either the population or the individual members.
Evidence for the existence of a red sequence at earlier cosmic times, beyond z = 1, emerged gradually, first through the discovery of a population of red galaxies (Dickinson et al. 2000; Smail et al. 2002b; Franx et al. 2003) at z ≈ 2, which were shown to be a mix of evolved and dusty galaxies (e.g., Smail et al. 2002b; Dunlop et al. 2007; Wuyts et al. 2007; Arnouts et al. 2007; Kriek et al. 2008; Brammer et al. 2009). Since then, it has become customary to characterize the galaxy population and its evolution in terms of a star-forming (main) sequence (Noeske et al. 2007) and a quiescent population, by separating the subgroups either on the basis of their specific star-formation rate (e.g., Whitaker et al. 2014) or in a color-color diagram, such as U − V versus V − J. These approaches allow us to differentiate between old stellar populations and younger, dust-reddened galaxies (e.g., Labbé et al. 2005; Williams et al. 2009; Brammer et al. 2011; Whitaker et al. 2011; Muzzin et al. 2013; Tacchella et al. 2018; Leja et al. 2019).
The goal of this short paper is to revisit the redshift evolution of the color distribution of galaxies. The immediate motivation is that with JWST/NIRCam, we can now measure very accurate and precise rest-frame optical-to-near-IR colors for the general galaxy population up to z ≈ 2.5. We demonstrate significant evolution in the rest-frame V − J color and a strong increase in dust attenuation by dust for massive star-forming galaxies from z = 0.5 to z = 2.5.
The improved insights into dusty galaxies at z ≳ 2 must also be seen in the context of parallel developments in far-IR and (sub)millimeter astronomy. A class of submillimeter galaxies at z ≈ 2, highly obscured in the optical and very luminous in thermal radiation from dust, was discovered in the late 1990s (Smail et al. 1997; Hughes et al. 1998) and has been an active area of research since (e.g., Smail et al. 2002b; Chapman et al. 2003; Daddi et al. 2007; Casey et al. 2013; Dunlop et al. 2017; McLure et al. 2018; Tacconi et al. 2018; Adscheid et al. 2024). Likewise, red, high-z galaxies connect to (ultra-)luminous IR galaxies, first discovered (Soifer et al. 1984) in the present-day Universe as exceptional, merger-driven starbursts (Lonsdale et al. 1984; Armus et al. 1987), and later at higher redshifts as relatively common occurrences (e.g., Lonsdale et al. 2004), reflective of two-orders of magnitude higher overall star-formation levels than ordinary star-forming galaxies. Without attempting to systematically connect the reddest galaxies found with NIRCam to the populations identified at longer wavelengths, we provide the necessary context by cross-matching our sample with the ALMA submillimeter-selected compilation from Adscheid et al. (2024) and show that this population overlaps and connects with our stellar-mass-selected sample.
We assumed a standard, flat Λ cold dark matter cosmology with H0 = 70 km s−1 Mpc−1 and Ωm = 0.3. We adopted the AB magnitude system (Oke & Gunn 1983) and the Chabrier (2003) initial mass function.
2. Data and sample selection
The parent sample is drawn from the Dawn JWST Archive (DJA) catalog2. This catalog contains photometry for over 400 000 galaxies in the five CANDELS fields (Grogin et al. 2011; Koekemoer et al. 2011) observed with JWST/NIRCam as part of the CEERS (Finkelstein et al. 2023, 2025), PRIMER (Dunlop et al. 2021), COSMOS-Web (Casey et al. 2023), and JADES (Eisenstein et al. 2023) programs.
The data reduction process, the photometry and the spectral energy distribution (SED) fitting approach are described by Valentino et al. (2023). In short, we used their 0.5′′ diameter aperture photometry on all available HST/ACS, HST/WFC3, and JWST/NIRCam imaging, ranging from 0.4 μm to 4.4 μm. Two aperture corrections then provided the total flux densities. The first correction accounts for the fraction of the flux for a point source outside the 0.5′′ aperture. This correction varies from filter to filter. The second correction is the multiplication by the ratio the AUTO flux and the aperture flux as measured in the detection image (typically, F277W+F356W+F444W). This correction is the same for all filters and accounts for the spatial extent of the source, but not color gradients. Colors gradients can be significant, but we verified that the colors within two F444W effective radii from the Sérsic models presented by Martorano et al. (2025) are not systematically different from our aperture colors. We prefer the aperture colors for this work because of their small uncertainties and model independence.
Photometric redshifts were inferred with EAZY (Brammer et al. 2008), with the agn_blue_sfhz_13 set of templates3, which consists of 13 templates from Flexible Stellar Populations Synthesis (FSPS; Conroy et al. 2009; Conroy & Gunn 2010), a template constructed from the NIRSpec spectrum of an extreme emission-line galaxy at z = 8.5, and a template generated to match the JWST/NIRSpec spectrum of a z = 4.5 source, which is thought to host an obscured active galactic nucleus (Killi et al. 2024). As input all available HST and JWST imaging datasets were used. For a detailed, field-by-field list we refer to Table 3 in Valentino et al. (2023), but for every object at least 12 wide filter photometric data points across the full wavelength range are available.
We selected galaxies with stellar mass M⋆ > 109 M⊙, which are all at least a magnitude brighter than the 5σ detection limit of PRIMER, the shallowest imaging dataset (Valentino et al. 2023), ensuring a stellar-mass-complete sample. We limited the redshift range to 0.5 < z < 2.5 to avoid overly large aperture corrections at low redshifts and the loss of rest-frame near-IR (J-band) coverage at high redshifts. We also rejected 3708 galaxies with poor SED fits (χ2 > 10). Our final sample consists of 27 758 galaxies, with as key parameters for this work: zph, M⋆, rest-frame U − V, rest-frame V − J and AV.
3. Results
3.1. Evolution and stellar mass dependence of rest-frame colors
The evolution of the color-M⋆ distribution is shown in Fig. 1. The redshift evolution in the (V − J)-M⋆ distribution for star-forming galaxies is quite remarkable. The (V − J)-M⋆ relation is very steep at z > 2, with a nearly 2 mag difference between M⋆ ≳ 1011 M⊙ and M⋆ < 1010 M⊙ galaxies. Low-mass galaxies become bluer with redshift (by about 0.3 mag from z < 1 to z > 2), indicative of higher levels of star-formation activity, without strong attenuation. High-mass galaxies, on the other hand, become redder with redshift.
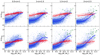 |
Fig. 1. Rest-frame U − V (upper panels) and V − J (lower panels) colors vs. stellar mass in four redshift bins. Star-forming galaxies are shown in blue and quiescent in red, separated by their location in the V − J vs. U − V color-color diagram as defined by Muzzin et al. (2013) and shown here in Fig. 2. Solid lines are running medians, calculated with a spline-quantile regression (COBS library; Ng & Maechler 2007, 2022). The dashed lines show the running median lines from the 0.5 < z < 1 (leftmost) panels. Green circles indicate submillimeter-detected galaxies. The error bars in the top-right corner of each panel show the median random uncertainty on the rest-frame colors, including the measurement uncertainty of the observed fluxes and the propagated uncertainties from the SED fit. |
Such red colors (V − J ≳ 2) can only be plausibly explained by dust reddening, since quiescent galaxies, which presumably have the oldest light-weighted ages, are not redder than V − J ≈ 1.2. This is the reason for the popularity of color-color diagrams, shown here in Fig. 2, to separate dusty galaxies from quiescent galaxies: dusty galaxies are redder in V − J (Williams et al. 2009; Ilbert et al. 2009; Whitaker et al. 2011) than even the oldest stellar populations, which are found in quiescent galaxies according to state-of-the-art spectroscopic data and modeling (Gallazzi et al. 2014; Chauke et al. 2018; Kaushal et al. 2024; Nersesian et al. 2025). These dusty, massive galaxies have been seen in near-IR surveys for decades, but in most previous works the colors of the reddest objects remained underestimated. The tail of red galaxies in V − J did not, generally, extend much beyond V − J ≈ 2 (e.g., Muzzin et al. 2013; van der Wel et al. 2014; Fang et al. 2018). Only Martis et al. (2019) find a tail of galaxies at V − J ≈ 2.5. With the new NIRCam photometry and current data analysis we see that the average color is V − J ≈ 2 for massive star-forming galaxies, with a tail reaching V − J ≈ 3. The issue is not that the reddest galaxies were undetected in HST surveys, but that their redshifts were generally overestimated and their rest-frame colors uncertain. Specifically, cross-matching the ASTRODEEP-JWST spectroscopic redshift (zsp) catalog (Merlin et al. 2024) with the DJA catalog used in this paper and the 3D-HST catalog (Skelton et al. 2014; Momcheva et al. 2016), we find 25 galaxies with measured zsp and V − J > 2.5. Our median zph = 1.64 matches well with the median zsp = 1.68, while in the 3D-HST catalog the median is zph, 3DHST = 2.12. For the full sample of 7124 matched objects there is no such offset: the two sets of zph estimates agree very well, to ≈1% on average, with < 1% catastrophic outliers (defined as deviating by more than 15% in 1 + z), with ≈5% scatter, and with no systematic departures up to V − J = 2.5. Even galaxies with with 2 < V − J < 2.5 show no systematic offsets, which are apparently limited to the small subset of the very reddest objects that nonetheless produce a pronounced change in the color distribution of z ≈ 2 galaxies when compared to lower z. It remains to be determined whether the new zph estimates are improved because of improved photometry or because of improved templates.
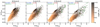 |
Fig. 2. Rest-frame U − V vs. V − J diagram in four redshift bins, showcasing the rise of very red galaxies at higher z and indicating the separation between star-forming and quiescent galaxies. |
As mentioned in the Introduction, the discovery of a population of dusty galaxies at z ≳ 2 in near-IR surveys was made in parallel with observations at longer wavelengths (e.g., Hughes et al. 1998; Smail et al. 1997, 2002a; Chapman et al. 2003; Daddi et al. 2007). To provide this context, we cross-matched our sample with the A3COSMOS and A3GOODSS catalogs (Adscheid et al. 2024), which collect all objects identified by ALMA across the COSMOS and GOODS fields. We find a match for 60 galaxies with separation < 0.4′′, all but one of which satisfy the homogeneous peak S/N = 5.40 criterion for blind extraction. The choice for < 0.4′′ serves as a compromise that allows for spatial offsets between stellar and dust emission while avoiding spurious matches. Reducing or increasing the search radius by 0.1′′ changes the number of matches by just three. This submillimeter-detected sample is not complete or representative for our sample, and it should be borne in mind that essentially all massive, star-forming galaxies are sufficiently bright at submillimeter wavelengths to be detected in sufficiently deep ALMA observations (Dunlop et al. 2017; McLure et al. 2018).
As shown in Fig. 1, the submillimeter-detected galaxies have typical stellar masses of M⋆ = 1011 M⊙ and are among the reddest 50% of the population in V − J. But they have average U − V colors, which illustrates that U − V color is a poor indicator of attenuation and far-IR luminosity. This is also illustrated by the strong evolution in V − J for massive star-forming galaxies – indicative of strong evolution in dust attenuation – in the absence of a similarly strong evolution in U − V. The U − V color, it seems, is a random draw, independent of dust mass and the level of star-formation. Such a random draw can be explained by the patchiness of dust in the UV, with a small number of random lines of sight that happen to reveal a small fraction of the young stellar population (Zhang et al. 2023; Gebek et al. 2025).
A clearly defined, tight color sequence exists for quiescent galaxies in both U − V and V − J, but at all redshifts V − J is blue rather than red compared to equally massive star-forming galaxies: the red sequence in U − V becomes a blue sequence in V − J. Quiescent galaxies become bluer with redshift in both U − V and V − J due to younger ages at earlier cosmic times. Similarly, the U − V colors of star-forming galaxies are bluer at higher redshifts (also see, e.g., Marchesini et al. 2014). These trends are, of course, well documented and expressed in terms of a blue cloud of low-mass star-forming galaxies and a red sequence of quiescent galaxies that dominate the red galaxies at z ≲ 1 (Bell et al. 2004b; Faber et al. 2007), with a minority of dust-reddened, star-forming galaxies mixed in at high mass (Bell et al. 2004a). But beyond z = 1 the quiescent red sequence in a color-mass or color-luminosity diagram becomes overwhelmed by dusty star-forming galaxies (e.g., Wuyts et al. 2007; Arnouts et al. 2007) that are, on average, equally red but have a larger scatter in U − V.
3.2. Evolution and stellar mass dependence of AV for star-forming galaxies
The connection between color and dust attenuation for star-forming galaxies4 is made explicit in Fig. 3. The most striking feature is the substantial increase in AV with redshift for massive star-forming galaxies. AV ≈ 1.2 for M⋆ ≳ 1011 M⊙ galaxies at z < 1, increasing to AV ≈ 2.6 for z > 2, with a tail up to AV ≈ 4 that is absent at lower z. Such a steep mass dependence is also reflected by the fraction of obscured star-formation in submillimeter-detected galaxies (Whitaker et al. 2017; Dunlop et al. 2017; McLure et al. 2018). Of course, AV has been inferred by many as part of SED fitting analysis for large samples of galaxies, but has not often been shown explicitly as a function of stellar mass and redshift. Only Martis et al. (2016) explicitly show this information, finding qualitatively similar trends: a higher AV for more massive galaxies, and an increase with redshift from AV ≈ 0.8 at z < 1 to AV ≈ 1.5 at z > 2 (also see Marchesini et al. 2014). But in quantitative terms, the mass- and redshift dependence are now much more pronounced and the z ≈ 2 population extends to much redder colors and higher AV.
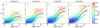 |
Fig. 3. AV vs. M⋆ for star-forming galaxies in four redshift bins. Points are color-coded with V − J color. White squares show the median in stellar mass bins and error bars the statistical uncertainty ( |

Approximately 90% of M⋆ > 1011 M⊙ star-forming galaxies at 1.5 < z < 2.5 have AV > 2, and ≈50% have AV > 3. Spectroscopic evidence for such high AV was recently shown by Cooper et al. (2025), Maheson et al. (2025) and, likewise, some submillimeter-detected galaxies are now shown to have equally high attenuation (Liu et al. 2025). This stark evolution with redshift was under-illuminated in the past, because of the aforementioned underestimation of rest-frame V − J colors of the reddest objects in most catalogs. To our knowledge, only Martis et al. (2019) found a tail of rest-frame V − J > 2 colors and AV > 3 in a near-IR-selected sample at z ≈ 2 − 3 that is absent at lower z. We speculate that the reason for the decline in AV with cosmic time is at least in part the consequence of the declining gas fraction. These massive galaxies likely have approximately solar metallicities at all z probed here, suggesting that the dust-to-gas ratio is similar across cosmic time. In addition, a change in dust geometry may play a role: where we see thin dust lanes in massive galaxies in the present-day Universe, the work by Gebek et al. (2025) suggests that the entire central region of a massive, star-forming galaxy is heavily obscured at z > 1.5. It should be kept in mind that AV estimates can be quite uncertain on a galaxy-by-galaxy basis (Pacifici et al. 2023). As a test, for our subsample of galaxies with V − J > 2.5 we inferred AV with a different SED modeling code (BAGPIPES, Carnall et al. 2018), allowing attenuation and metallicity to vary freely up to AV = 5 (Calzetti et al. 2000) and Z = 2.5 Z⊙, and a double power-law star-formation history. We find very comparable AV values compared to EAZY: 0.1 mag redder in the median, and 0.2 mag scatter, consistent with our uncertainties. The increase in AV with redshift does not lead to redder U − V colors (Fig. 1), and submillimeter-detected galaxies are only slightly redder than average, with large scatter. A high AV with a relatively un-reddened U − V color requires a gray attenuation curve in the UV-optical. As shown recently by Gebek et al. (2025), a plausible explanation is that not only young stars (< 100 Myr), but all stars younger than 1 Gyr – a large fraction or even the majority of all stars at z ≈ 2 – are attenuated by a birth cloud-like component (Charlot & Fall 2000). Note that in our lowest stellar mass bin AV values remain small. It increases with redshift, but only slightly, from AV ≈ 0.3 at z < 1 to AV ≈ 0.4 at z > 2 (this despite the bluer colors at higher z).
4. Conclusion
Although it has been abundantly clear for decades that there exists a population of red galaxies at z > 1, JWST/NIRCam presents a new opportunity to describe the distribution of rest-frame UV-optical-to-near-IR colors and AV values for the general galaxy population up to z = 2.5 and down to low stellar masses (here, M⋆ = 109 M⊙). The rest-frame U − V-stellar mass diagram is familiar, and shows a distinct red sequence of passive galaxies and a population of star-forming galaxies that are blue at low masses and redder at higher masses. The rest-frame V − J-stellar mass distribution is remarkably different: The red sequence is more accurately described as a blue sequence. At M⋆ ≳ 3 × 10¹⁰ M⊙, star-forming galaxies are much redder than quiescent galaxies, particularly at z > 1.5. The red colors are explained by large AV values. Nearly all massive star-forming galaxies at z > 1.5 have AV > 2. The photometric redshifts for the particular subset of extremely attenuated galaxies have markedly improved thanks to the precise NIRCam photometry, as shown by a comparison with spectroscopic redshift measurements, which explains why the strong redshift evolution in V − J and AV went largely unnoticed until now.
The overall goal of this paper has been to showcase the accurate and precise colors that the HST-JWST tandem affords, and provide a reference for the redshift evolution of rest-frame UV-optical-near-IR colors and AV values as a function of stellar mass. In a follow-up paper we will show that the high AV values are associated with strong radial color gradients, improving our understanding of the strong wavelength dependence of measured galaxy sizes and its interpretation.
A comprehensive spectroscopic survey of high-AV galaxies at z > 1, essentially a targeted extension of the results on subsamples of other surveys that currently exist (Cooper et al. 2025; Maheson et al. 2025), is needed to understand the physical conditions in the centers of massive galaxies with large dust columns and high star-formation activity. Ground-based spectroscopic surveys are unavoidably biased toward the less attenuated galaxies, not exceeding AV ≈ 1 (e.g., Tacchella et al. 2018; Cullen et al. 2018; Lorenz et al. 2024). Furthermore, since the proportion of high-AV galaxies is still rapidly increasing from z = 1.5 to z = 2.5, an extension to higher redshifts is needed to determine when attenuation peaked in cosmic time. This may be linked to the population of optically dark, dust-obscured galaxies at z ≳ 3 (Franco et al. 2018; Barrufet et al. 2023). A redshift extension also serves to connect the narrative of massive, dusty galaxies at intermediate redshifts with the surprising presence of dusty galaxies at even higher redshifts (z > 5; e.g., Endsley et al. 2023; Akins et al. 2023; Barro et al. 2024; Shapley et al. 2025; Narayanan et al. 2025; Martis et al. 2025).
The term “quenching” in reference to the galaxy-wide cessation of star formation caused by a heating or feedback process was, to the best of our knowledge, first used by Cox (1983). This paper was cited once in the past decade, and only in the context of molecular cloud properties.
AV estimates of quiescent galaxies carry the additional uncertainty due to our limited knowledge of the intrinsic near-IR colors of evolved stellar populations. There is compelling evidence of somewhat dusty quiescent galaxies (e.g., Siegel et al. 2025), but it is a distinct possibility that SED fitting codes use reddening to correct for template mismatches (e.g., Appendix B in van der Wel et al. 2021).
Acknowledgments
This work is based on observations made with the NASA/ESA/CSA James Webb Space Telescope. The data were obtained from the Mikulski Archive for Space Telescopes at the Space Telescope Science Institute, which is operated by the Association of Universities for Research in Astronomy, Inc., under NASA contract NAS 5–03127 for JWST. The specific observations analyzed can be accessed via doi http://dx.doi.org/10.26093/cds/vizier. These observations are associated with programs ERS #1324, 1345, and 1355; ERO #2736; GO #1837 and 2822; GTO #2738; and COM #1063. The authors acknowledge the teams and PIs for developing their observing program with a zero-exclusive-access period. MM acknowledges the financial support of the Flemish Fund for Scientific Research (FWO-Vlaanderen), research project G030319N. (Some of) The data products presented herein were retrieved from the Dawn JWST Archive (DJA). DJA is an initiative of the Cosmic Dawn Center (DAWN), which is funded by the Danish National Research Foundation under grant DNRF140. JSD acknowledges the support of the Royal Society via the award of a Research Professorship.
References
- Adscheid, S., Magnelli, B., Liu, D., et al. 2024, A&A, 685, A1 [NASA ADS] [CrossRef] [EDP Sciences] [Google Scholar]
- Akins, H. B., Casey, C. M., Allen, N., et al. 2023, ApJ, 956, 61 [NASA ADS] [CrossRef] [Google Scholar]
- Armus, L., Heckman, T., & Miley, G. 1987, AJ, 94, 831 [Google Scholar]
- Arnouts, S., Walcher, C. J., Le Fèvre, O., et al. 2007, A&A, 476, 137 [CrossRef] [EDP Sciences] [Google Scholar]
- Barro, G., Pérez-González, P. G., Kocevski, D. D., et al. 2024, ApJ, 963, 128 [CrossRef] [Google Scholar]
- Barrufet, L., Oesch, P. A., Weibel, A., et al. 2023, MNRAS, 522, 449 [NASA ADS] [CrossRef] [Google Scholar]
- Baum, W. A. 1959, PASP, 71, 106 [Google Scholar]
- Bell, E. F., McIntosh, D. H., Barden, M., et al. 2004a, ApJ, 600, L11 [NASA ADS] [CrossRef] [Google Scholar]
- Bell, E. F., Wolf, C., Meisenheimer, K., et al. 2004b, ApJ, 608, 752 [NASA ADS] [CrossRef] [Google Scholar]
- Blanton, M. R., Hogg, D. W., Bahcall, N. A., et al. 2003, ApJ, 594, 186 [NASA ADS] [CrossRef] [Google Scholar]
- Bower, R. G., Lucey, J. R., & Ellis, R. S. 1992, MNRAS, 254, 601 [NASA ADS] [CrossRef] [Google Scholar]
- Brammer, G. B., van Dokkum, P. G., & Coppi, P. 2008, ApJ, 686, 1503 [Google Scholar]
- Brammer, G. B., Whitaker, K. E., van Dokkum, P. G., et al. 2009, ApJ, 706, L173 [Google Scholar]
- Brammer, G. B., Whitaker, K. E., van Dokkum, P. G., et al. 2011, ApJ, 739, 24 [NASA ADS] [CrossRef] [Google Scholar]
- Brown, M. J. I., Dey, A., Jannuzi, B. T., et al. 2007, ApJ, 654, 858 [Google Scholar]
- Calzetti, D., Armus, L., Bohlin, R. C., et al. 2000, ApJ, 533, 682 [NASA ADS] [CrossRef] [Google Scholar]
- Carnall, A. C., McLure, R. J., Dunlop, J. S., & Davé, R. 2018, MNRAS, 480, 4379 [Google Scholar]
- Casey, C. M., Chen, C.-C., Cowie, L. L., et al. 2013, MNRAS, 436, 1919 [NASA ADS] [CrossRef] [Google Scholar]
- Casey, C. M., Kartaltepe, J. S., Drakos, N. E., et al. 2023, ApJ, 954, 31 [NASA ADS] [CrossRef] [Google Scholar]
- Chabrier, G. 2003, PASP, 115, 763 [Google Scholar]
- Chapman, S. C., Windhorst, R., Odewahn, S., Yan, H., & Conselice, C. 2003, ApJ, 599, 92 [NASA ADS] [CrossRef] [Google Scholar]
- Charlot, S., & Fall, S. M. 2000, ApJ, 539, 718 [Google Scholar]
- Chauke, P., van der Wel, A., Pacifici, C., et al. 2018, ApJ, 861, 13 [NASA ADS] [CrossRef] [Google Scholar]
- Conroy, C., & Gunn, J. E. 2010, ApJ, 712, 833 [Google Scholar]
- Conroy, C., Gunn, J. E., & White, M. 2009, ApJ, 699, 486 [Google Scholar]
- Cooper, O. R., Brammer, G., Heintz, K. E., et al. 2025, ApJ, 982, 125 [Google Scholar]
- Cox, D. P. 1983, ApJ, 265, L61 [Google Scholar]
- Cullen, F., McLure, R. J., Khochfar, S., et al. 2018, MNRAS, 476, 3218 [Google Scholar]
- Daddi, E., Dickinson, M., Morrison, G., et al. 2007, ApJ, 670, 156 [NASA ADS] [CrossRef] [Google Scholar]
- de Vaucouleurs, G. 1961, ApJS, 5, 233 [NASA ADS] [CrossRef] [Google Scholar]
- Dickinson, M., Hanley, C., Elston, R., et al. 2000, ApJ, 531, 624 [Google Scholar]
- Dunlop, J. S., Cirasuolo, M., & McLure, R. J. 2007, MNRAS, 376, 1054 [NASA ADS] [CrossRef] [Google Scholar]
- Dunlop, J. S., McLure, R. J., Biggs, A. D., et al. 2017, MNRAS, 466, 861 [Google Scholar]
- Dunlop, J. S., Abraham, R. G., Ashby, M. L. N., et al. 2021, PRIMER: Public Release IMaging for Extragalactic Research, JWST Proposal. Cycle 1, ID. \#1837 [Google Scholar]
- Eisenstein, D. J., Willott, C., Alberts, S., et al. 2023, arXiv e-prints [arXiv:2306.02465] [Google Scholar]
- Ellis, R. S., Smail, I., Dressler, A., et al. 1997, ApJ, 483, 582 [NASA ADS] [CrossRef] [Google Scholar]
- Endsley, R., Stark, D. P., Whitler, L., et al. 2023, MNRAS, 524, 2312 [NASA ADS] [CrossRef] [Google Scholar]
- Faber, S. M., Willmer, C. N. A., Wolf, C., et al. 2007, ApJ, 665, 265 [Google Scholar]
- Fang, J. J., Faber, S. M., Koo, D. C., et al. 2018, ApJ, 858, 100 [NASA ADS] [CrossRef] [Google Scholar]
- Finkelstein, S. L., Bagley, M. B., Ferguson, H. C., et al. 2023, ApJ, 946, L13 [NASA ADS] [CrossRef] [Google Scholar]
- Finkelstein, S. L., Bagley, M. B., Arrabal Haro, P., et al. 2025, ApJ, 983, L4 [Google Scholar]
- Franco, M., Elbaz, D., Béthermin, M., et al. 2018, A&A, 620, A152 [NASA ADS] [CrossRef] [EDP Sciences] [Google Scholar]
- Franx, M., Labbé, I., Rudnick, G., et al. 2003, ApJ, 587, L79 [Google Scholar]
- Gallazzi, A., Bell, E. F., Zibetti, S., Brinchmann, J., & Kelson, D. D. 2014, ApJ, 788, 72 [Google Scholar]
- Gebek, A., Diemer, B., Martorano, M., et al. 2025, A&A, 695, A90 [NASA ADS] [CrossRef] [EDP Sciences] [Google Scholar]
- Gladders, M. D., López-Cruz, O., Yee, H. K. C., & Kodama, T. 1998, ApJ, 501, 571 [NASA ADS] [CrossRef] [Google Scholar]
- Grogin, N. A., Kocevski, D. D., Faber, S. M., et al. 2011, ApJS, 197, 35 [NASA ADS] [CrossRef] [Google Scholar]
- Holmberg, E. 1950, Meddelanden fran Lunds Astronomiska Observatorium Serie II, 128, 5 [Google Scholar]
- Hughes, D. H., Serjeant, S., Dunlop, J., et al. 1998, Nature, 394, 241 [Google Scholar]
- Ilbert, O., Capak, P., Salvato, M., et al. 2009, ApJ, 690, 1236 [NASA ADS] [CrossRef] [Google Scholar]
- Kaushal, Y., Nersesian, A., Bezanson, R., et al. 2024, ApJ, 961, 118 [NASA ADS] [CrossRef] [Google Scholar]
- Killi, M., Watson, D., Brammer, G., et al. 2024, A&A, 691, A52 [NASA ADS] [CrossRef] [EDP Sciences] [Google Scholar]
- Koekemoer, A. M., Faber, S. M., Ferguson, H. C., et al. 2011, ApJS, 197, 36 [NASA ADS] [CrossRef] [Google Scholar]
- Kriek, M., van der Wel, A., van Dokkum, P. G., Franx, M., & Illingworth, G. D. 2008, ApJ, 682, 896 [NASA ADS] [CrossRef] [Google Scholar]
- Labbé, I., Huang, J., Franx, M., et al. 2005, ApJ, 624, L81 [Google Scholar]
- Leja, J., Tacchella, S., & Conroy, C. 2019, ApJ, 880, L9 [NASA ADS] [CrossRef] [Google Scholar]
- Liu, F. Y., Dunlop, J. S., McLure, R. J., et al. 2025, arXiv e-prints [arXiv:2503.07774] [Google Scholar]
- Lonsdale, C. J., Persson, S. E., & Matthews, K. 1984, ApJ, 287, 95 [CrossRef] [Google Scholar]
- Lonsdale, C., Polletta, M. d. C., Surace, J., et al. 2004, ApJS, 154, 54 [NASA ADS] [CrossRef] [Google Scholar]
- Lorenz, B., Kriek, M., Shapley, A. E., et al. 2024, ApJ, 975, 187 [NASA ADS] [CrossRef] [Google Scholar]
- Maheson, G., Tacchella, S., Belli, S., et al. 2025, arXiv e-prints [arXiv:2504.15346] [Google Scholar]
- Marchesini, D., Muzzin, A., Stefanon, M., et al. 2014, ApJ, 794, 65 [NASA ADS] [CrossRef] [Google Scholar]
- Martis, N. S., Marchesini, D., Brammer, G. B., et al. 2016, ApJ, 827, L25 [CrossRef] [Google Scholar]
- Martis, N. S., Marchesini, D. M., Muzzin, A., et al. 2019, ApJ, 882, 65 [NASA ADS] [CrossRef] [Google Scholar]
- Martis, N., Withers, S., Felicioni, G., et al. 2025, arXiv e-prints [arXiv:2503.01579] [Google Scholar]
- Martorano, M., van der Wel, A., Baes, M., et al. 2025, A&A, 694, A76 [NASA ADS] [CrossRef] [EDP Sciences] [Google Scholar]
- McLure, R. J., Pentericci, L., Cimatti, A., et al. 2018, MNRAS, 479, 25 [NASA ADS] [Google Scholar]
- Merlin, E., Santini, P., Paris, D., et al. 2024, A&A, 691, A240 [NASA ADS] [CrossRef] [EDP Sciences] [Google Scholar]
- Momcheva, I. G., Brammer, G. B., van Dokkum, P. G., et al. 2016, ApJS, 225, 27 [Google Scholar]
- Muzzin, A., Marchesini, D., Stefanon, M., et al. 2013, ApJ, 777, 18 [NASA ADS] [CrossRef] [Google Scholar]
- Narayanan, D., Stark, D. P., Finkelstein, S. L., et al. 2025, ApJ, 982, 7 [Google Scholar]
- Nersesian, A., van der Wel, A., Gallazzi, A. R., et al. 2025, A&A, 695, A86 [NASA ADS] [CrossRef] [EDP Sciences] [Google Scholar]
- Ng, P., & Maechler, M. 2007, Stat. Model., 7, 315 [CrossRef] [Google Scholar]
- Ng, P., & Maechler, M. 2022, COBS - Constrained B-splines (Sparse matrix based), r package version 1.3-5 [Google Scholar]
- Noeske, K. G., Weiner, B. J., Faber, S. M., et al. 2007, ApJ, 660, L43 [CrossRef] [Google Scholar]
- Oke, J. B., & Gunn, J. E. 1983, ApJ, 266, 713 [NASA ADS] [CrossRef] [Google Scholar]
- Pacifici, C., Iyer, K. G., Mobasher, B., et al. 2023, ApJ, 944, 141 [NASA ADS] [CrossRef] [Google Scholar]
- Pettit, E. 1954, ApJ, 120, 413 [Google Scholar]
- Phleps, S., Peacock, J. A., Meisenheimer, K., & Wolf, C. 2006, A&A, 457, 145 [NASA ADS] [CrossRef] [EDP Sciences] [Google Scholar]
- Shapley, A. E., Sanders, R. L., Topping, M. W., et al. 2025, ApJ, 981, 167 [Google Scholar]
- Siegel, J. C., Setton, D. J., Greene, J. E., et al. 2025, ApJ, 985, 125 [Google Scholar]
- Skelton, R. E., Whitaker, K. E., Momcheva, I. G., et al. 2014, ApJS, 214, 24 [Google Scholar]
- Smail, I., Ivison, R. J., & Blain, A. W. 1997, ApJ, 490, L5 [NASA ADS] [CrossRef] [Google Scholar]
- Smail, I., Ivison, R. J., Blain, A. W., & Kneib, J. P. 2002a, MNRAS, 331, 495 [CrossRef] [Google Scholar]
- Smail, I., Owen, F. N., Morrison, G. E., et al. 2002b, ApJ, 581, 844 [NASA ADS] [CrossRef] [Google Scholar]
- Soifer, B. T., Rowan-Robinson, M., Houck, J. R., et al. 1984, ApJ, 278, L71 [NASA ADS] [CrossRef] [Google Scholar]
- Stanford, S. A., Eisenhardt, P. R., & Dickinson, M. 1998, ApJ, 492, 461 [NASA ADS] [CrossRef] [Google Scholar]
- Tacchella, S., Carollo, C. M., Förster Schreiber, N. M., et al. 2018, ApJ, 859, 56 [Google Scholar]
- Tacconi, L. J., Genzel, R., Saintonge, A., et al. 2018, ApJ, 853, 179 [Google Scholar]
- Valentino, F., Brammer, G., Gould, K. M. L., et al. 2023, ApJ, 947, 20 [NASA ADS] [CrossRef] [Google Scholar]
- van der Wel, A., Holden, B. P., Zirm, A. W., et al. 2008, ApJ, 688, 48 [NASA ADS] [CrossRef] [Google Scholar]
- van der Wel, A., Franx, M., van Dokkum, P. G., et al. 2014, ApJ, 788, 28 [Google Scholar]
- van der Wel, A., Bezanson, R., D’Eugenio, F., et al. 2021, ApJS, 256, 44 [NASA ADS] [CrossRef] [Google Scholar]
- van Dokkum, P. G., & Franx, M. 1996, MNRAS, 281, 985 [NASA ADS] [CrossRef] [Google Scholar]
- van Dokkum, P. G., Franx, M., Kriek, M., et al. 2008, ApJ, 677, L5 [Google Scholar]
- Whitaker, K. E., Labbé, I., van Dokkum, P. G., et al. 2011, ApJ, 735, 86 [Google Scholar]
- Whitaker, K. E., Franx, M., Leja, J., et al. 2014, ApJ, 795, 104 [NASA ADS] [CrossRef] [Google Scholar]
- Whitaker, K. E., Pope, A., Cybulski, R., et al. 2017, ApJ, 850, 208 [NASA ADS] [CrossRef] [Google Scholar]
- Williams, R. J., Quadri, R. F., Franx, M., van Dokkum, P., & Labbé, I. 2009, ApJ, 691, 1879 [NASA ADS] [CrossRef] [Google Scholar]
- Wuyts, S., Labbé, I., Franx, M., et al. 2007, ApJ, 655, 51 [NASA ADS] [CrossRef] [Google Scholar]
- Zhang, J., Wuyts, S., Cutler, S. E., et al. 2023, MNRAS, 524, 4128 [Google Scholar]
All Figures
|
Fig. 1. Rest-frame U − V (upper panels) and V − J (lower panels) colors vs. stellar mass in four redshift bins. Star-forming galaxies are shown in blue and quiescent in red, separated by their location in the V − J vs. U − V color-color diagram as defined by Muzzin et al. (2013) and shown here in Fig. 2. Solid lines are running medians, calculated with a spline-quantile regression (COBS library; Ng & Maechler 2007, 2022). The dashed lines show the running median lines from the 0.5 < z < 1 (leftmost) panels. Green circles indicate submillimeter-detected galaxies. The error bars in the top-right corner of each panel show the median random uncertainty on the rest-frame colors, including the measurement uncertainty of the observed fluxes and the propagated uncertainties from the SED fit. |
| In the text | |
|
Fig. 2. Rest-frame U − V vs. V − J diagram in four redshift bins, showcasing the rise of very red galaxies at higher z and indicating the separation between star-forming and quiescent galaxies. |
| In the text | |
|
Fig. 3. AV vs. M⋆ for star-forming galaxies in four redshift bins. Points are color-coded with V − J color. White squares show the median in stellar mass bins and error bars the statistical uncertainty ( |
| In the text | |
Current usage metrics show cumulative count of Article Views (full-text article views including HTML views, PDF and ePub downloads, according to the available data) and Abstracts Views on Vision4Press platform.
Data correspond to usage on the plateform after 2015. The current usage metrics is available 48-96 hours after online publication and is updated daily on week days.
Initial download of the metrics may take a while.