Fig. 3.
Download original image
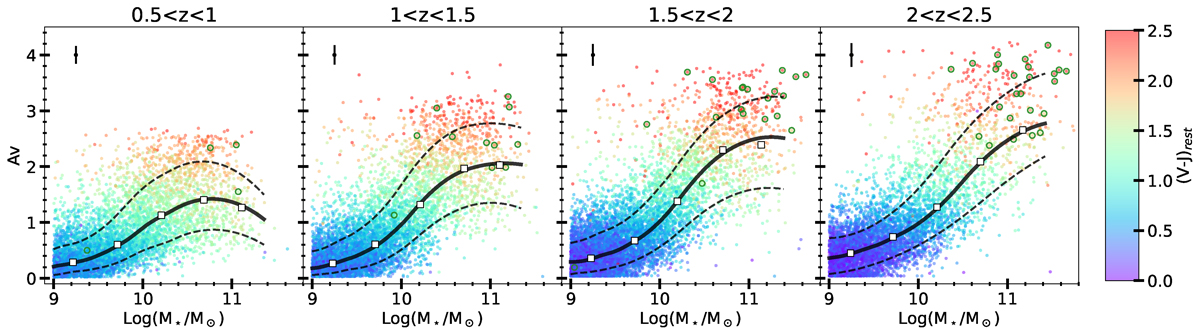
AV vs. M⋆ for star-forming galaxies in four redshift bins. Points are color-coded with V − J color. White squares show the median in stellar mass bins and error bars the statistical uncertainty (![]() , mostly smaller than the data points themselves). The solid black lines show the spline-percentile regression, and the dashed lines show the 16–84 percentiles of the distribution. The error bars are the median uncertainties from the observed fluxes and propagated uncertainties from the SED fit.
, mostly smaller than the data points themselves). The solid black lines show the spline-percentile regression, and the dashed lines show the 16–84 percentiles of the distribution. The error bars are the median uncertainties from the observed fluxes and propagated uncertainties from the SED fit.
Current usage metrics show cumulative count of Article Views (full-text article views including HTML views, PDF and ePub downloads, according to the available data) and Abstracts Views on Vision4Press platform.
Data correspond to usage on the plateform after 2015. The current usage metrics is available 48-96 hours after online publication and is updated daily on week days.
Initial download of the metrics may take a while.