Open Access
Fig. B.7
Download original image
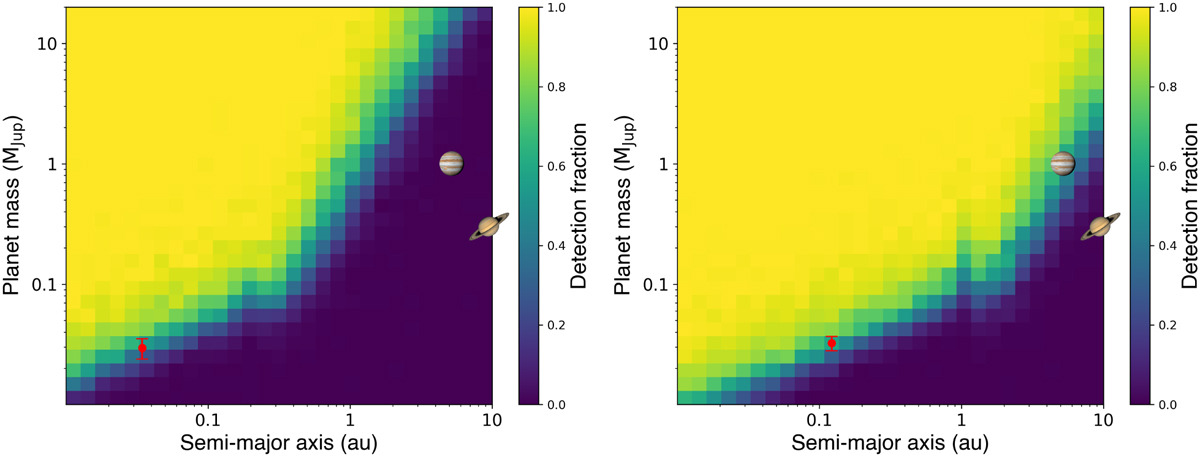
HARPS and HARPS-N RV detection maps for TOI-5800 (left) and TOI-5817 (right). The colour scale expresses the detection fraction (i.e. the detection probability), while the red circles mark the position of TOI-5800 b (left) and TOI-5817 b (right). Jupiter and Saturn are shown for comparison.
Current usage metrics show cumulative count of Article Views (full-text article views including HTML views, PDF and ePub downloads, according to the available data) and Abstracts Views on Vision4Press platform.
Data correspond to usage on the plateform after 2015. The current usage metrics is available 48-96 hours after online publication and is updated daily on week days.
Initial download of the metrics may take a while.