Open Access
Fig. 3
Download original image
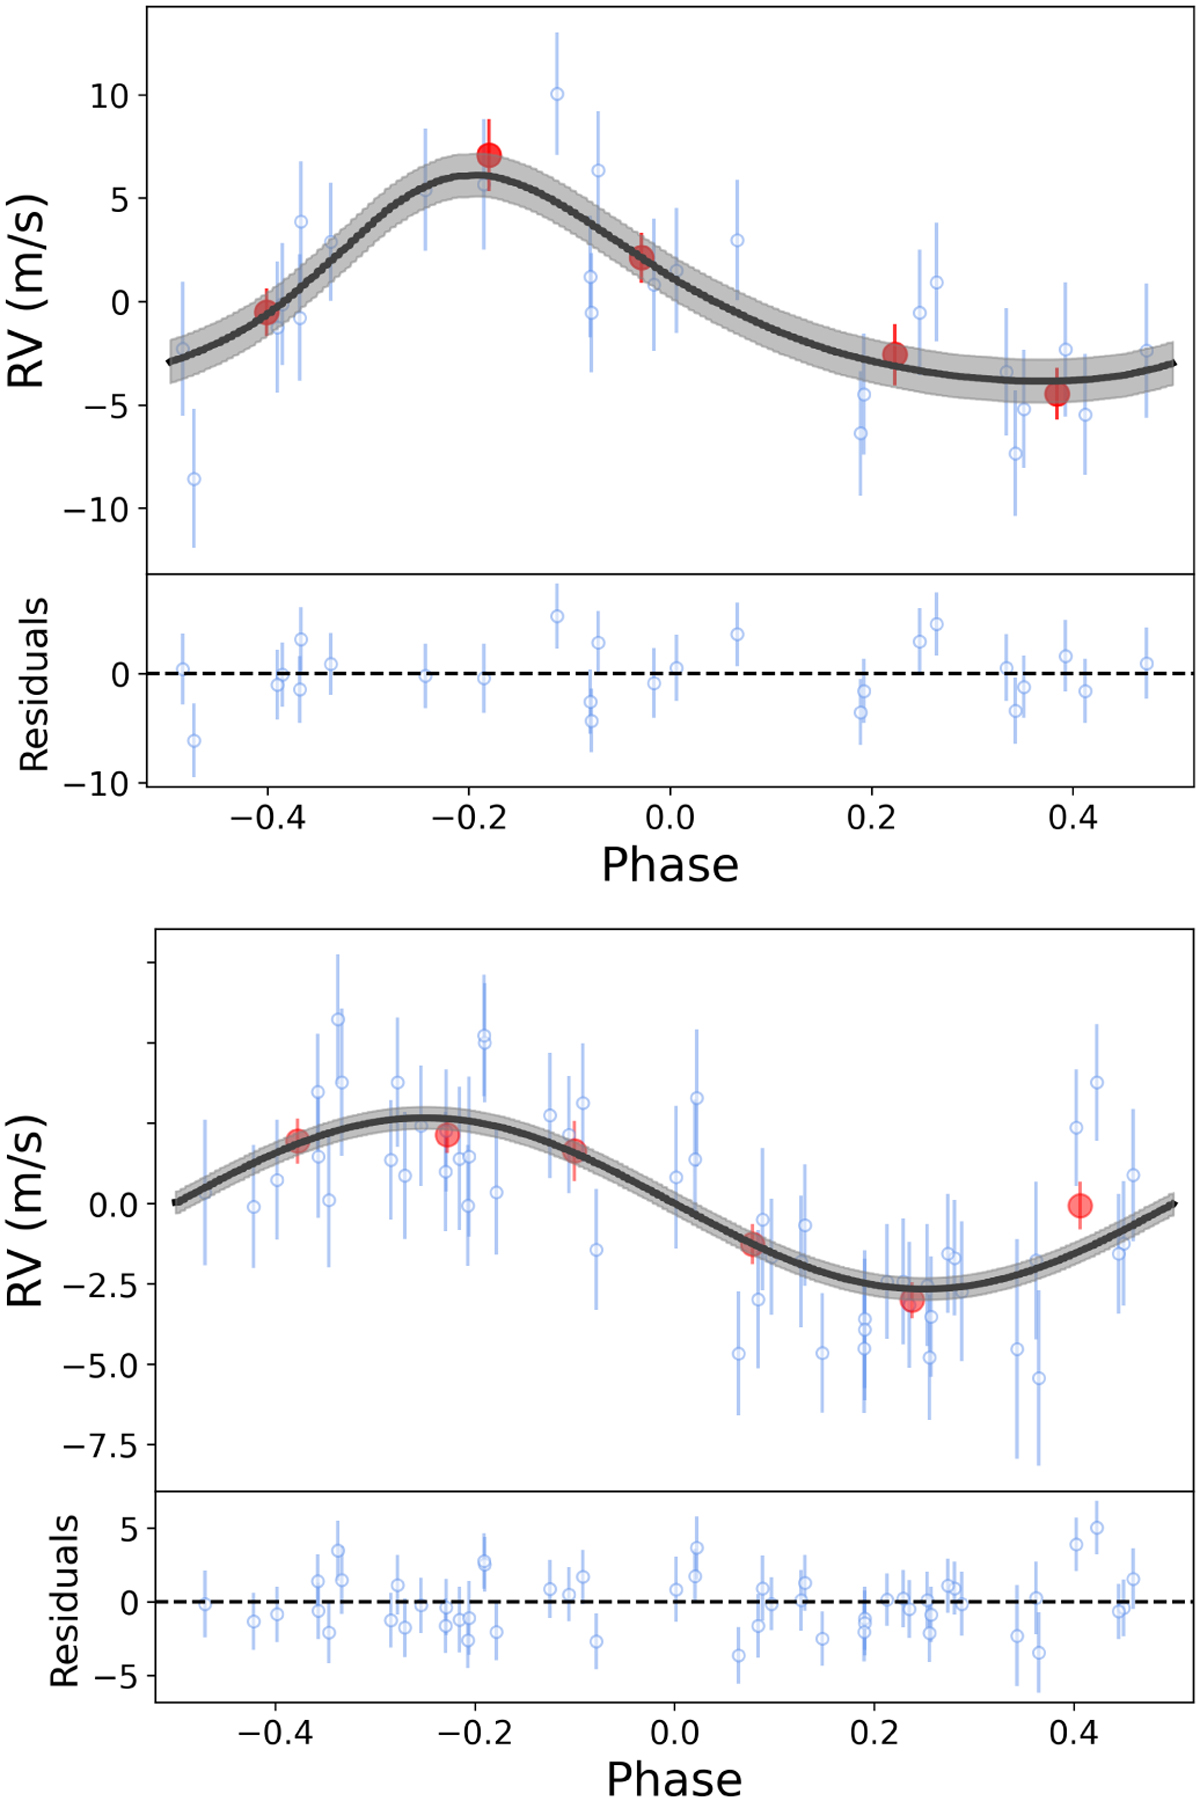
Phased HARPS RVs of TOI-5800 b (top) and phased HARPS-N RVs of TOI-5817 b (bottom) along with the fitted models, in black, and their residuals below each panel. The red circles represent the average of ~5 and ~9 RVs, respectively, while the grey areas represent the 1σ deviation from the model.
Current usage metrics show cumulative count of Article Views (full-text article views including HTML views, PDF and ePub downloads, according to the available data) and Abstracts Views on Vision4Press platform.
Data correspond to usage on the plateform after 2015. The current usage metrics is available 48-96 hours after online publication and is updated daily on week days.
Initial download of the metrics may take a while.