Fig. 11
Download original image
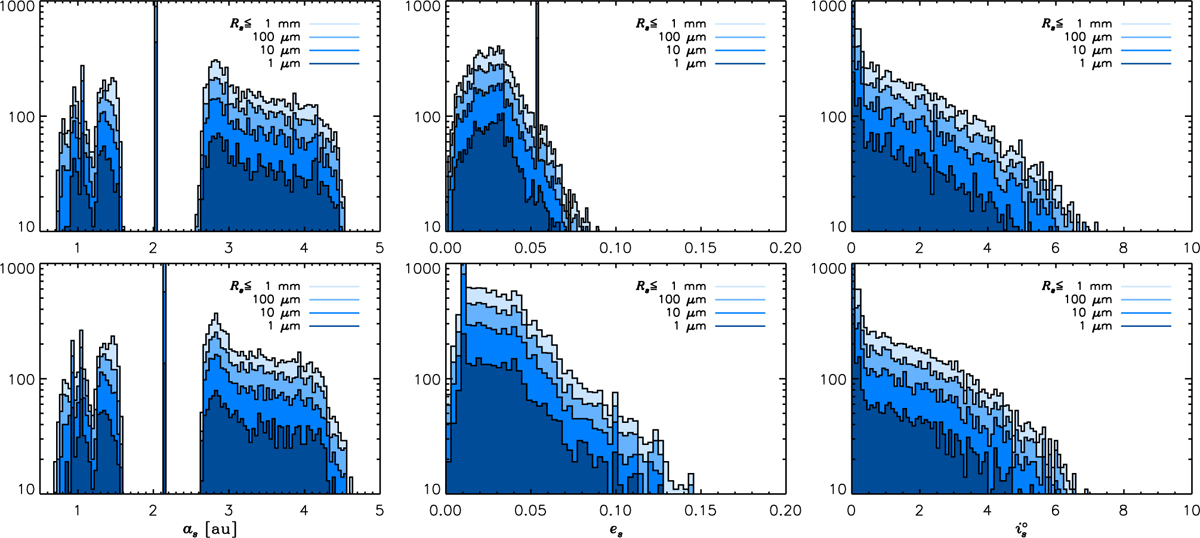
Histograms of dust orbital properties as in Figure 9, but for a model that contains a giant planet. Top and bottom panels display distributions at a binary phase around apocenter and pericenter passage, respectively. Histograms are stacked in order of increasing dust size, as indicated. The enhanced concentrations around 2–2.1 au in the left panels correspond to particles orbiting the planet. The narrow high peaks in the eccentricity distributions are generated by grains that move along the edges of the tidal gap opened by the planet (see also bottom panels of Figure 12).
Current usage metrics show cumulative count of Article Views (full-text article views including HTML views, PDF and ePub downloads, according to the available data) and Abstracts Views on Vision4Press platform.
Data correspond to usage on the plateform after 2015. The current usage metrics is available 48-96 hours after online publication and is updated daily on week days.
Initial download of the metrics may take a while.