Fig. 12
Download original image
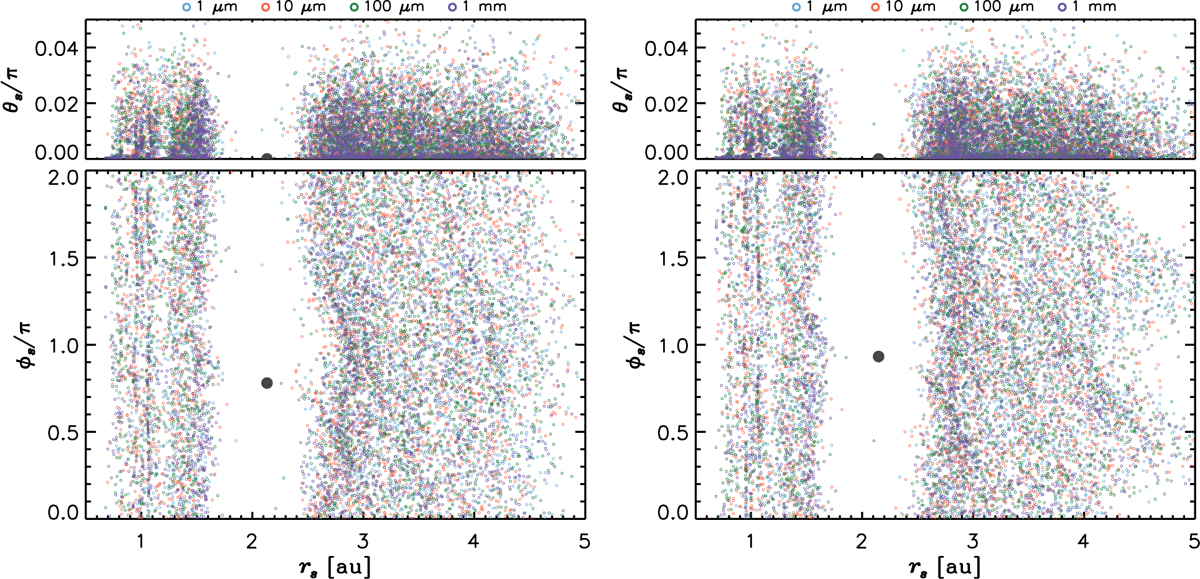
Three-dimensional distributions of dust, for the model represented in Figure 11, displayed at a binary phase around apocenter passage (left) and pericenter passage (right). The positions of the dust are projected in the r-θ plane in the top panels (θs = 0 at the disk mid-plane) and r-ϕ plane. Dust of different sizes are rendered by different colors, as indicated in the legend. The filled gray circles represent the position of the planet.
Current usage metrics show cumulative count of Article Views (full-text article views including HTML views, PDF and ePub downloads, according to the available data) and Abstracts Views on Vision4Press platform.
Data correspond to usage on the plateform after 2015. The current usage metrics is available 48-96 hours after online publication and is updated daily on week days.
Initial download of the metrics may take a while.