Fig. 2
Download original image
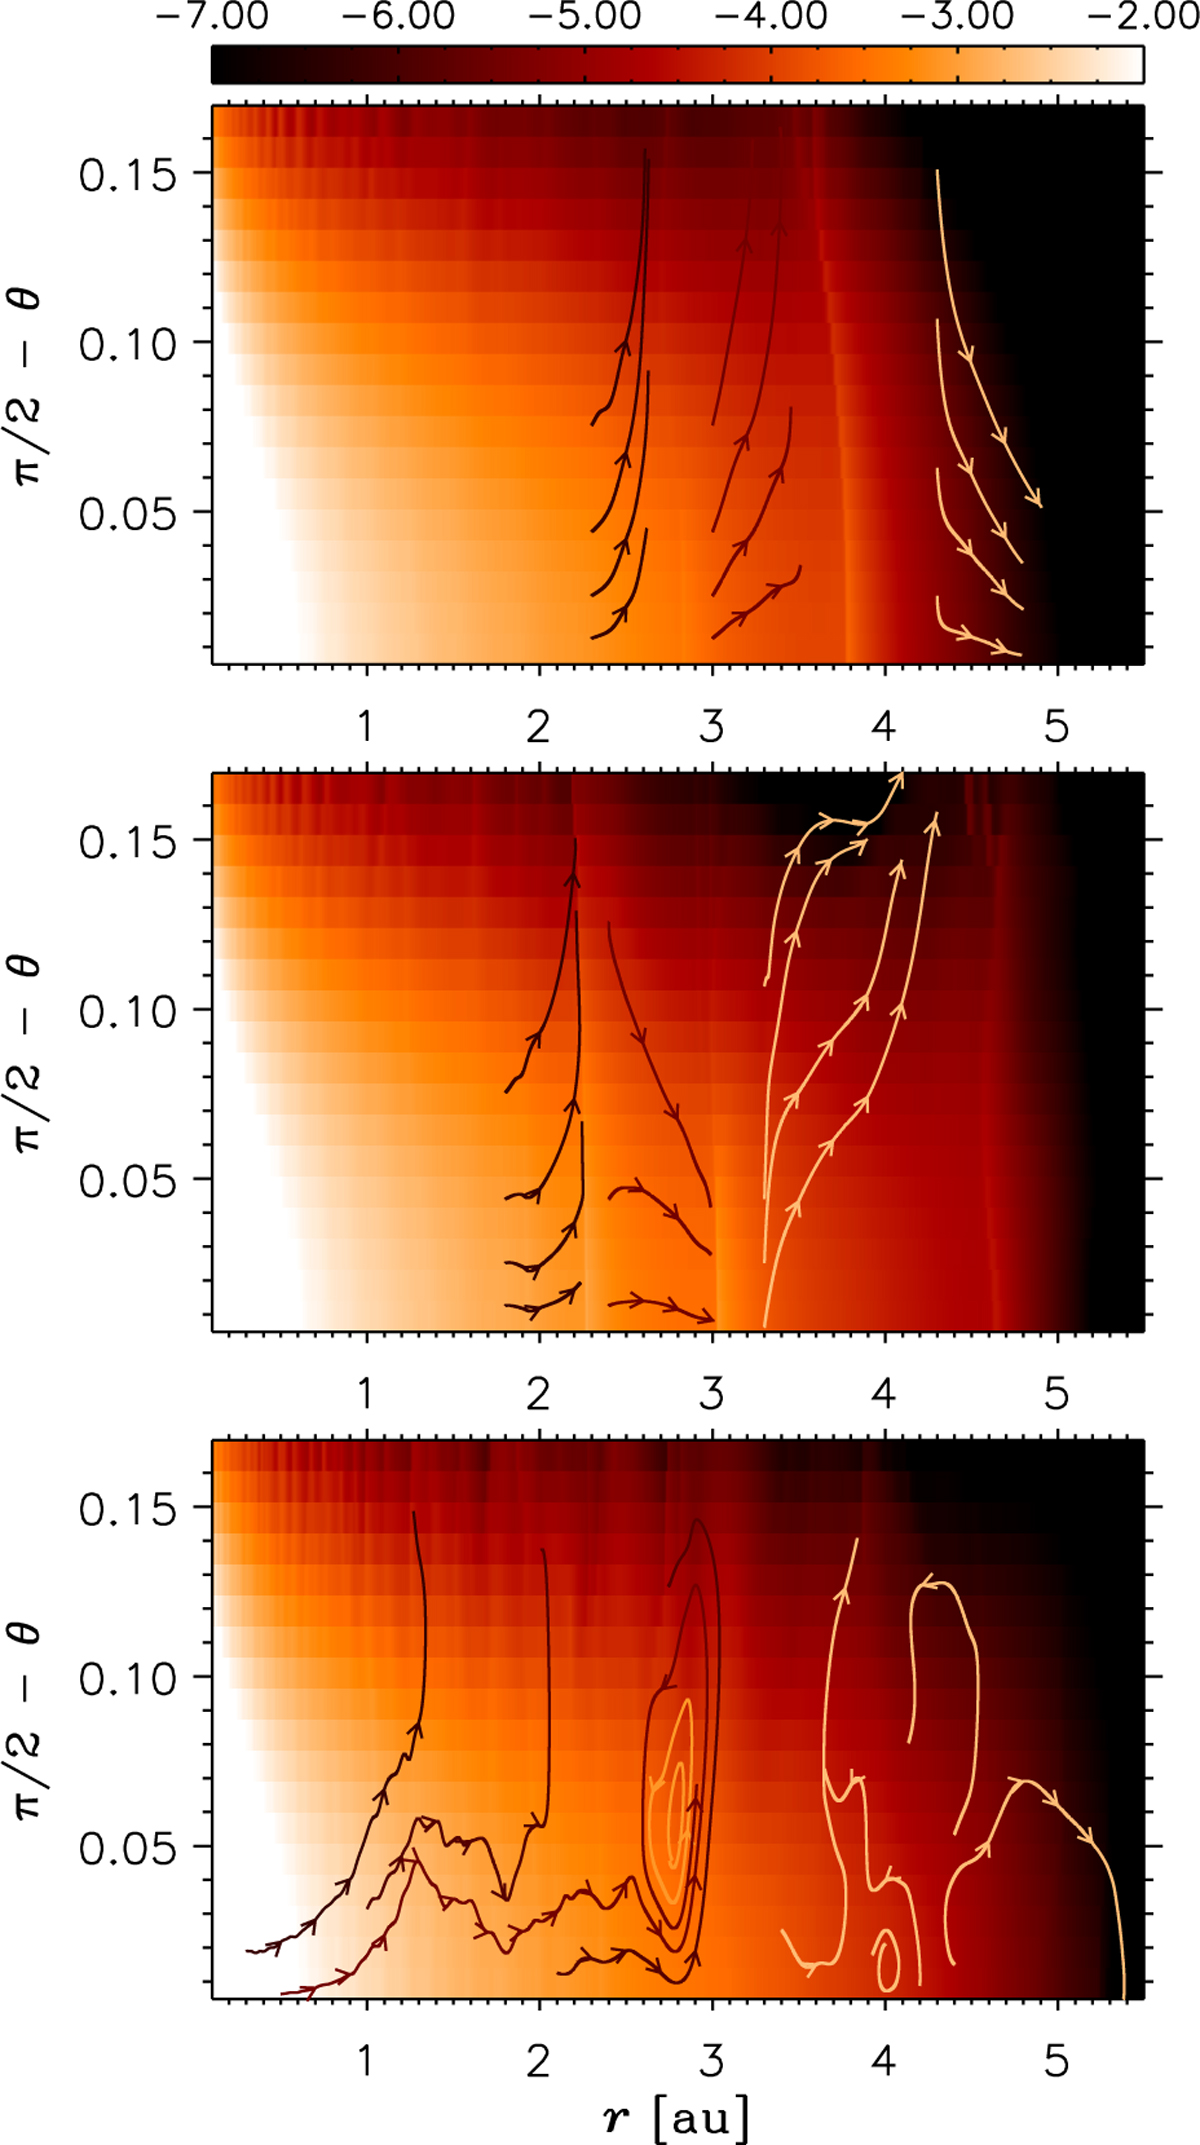
Volume gas density in a r-θ plane, in units of MA/au3 and logarithmic scale, from the 3D model of Figure 1. The orbital phase of the binary corresponds to a time ≈0.06 T (top) and ≈0.13 T (middle), after pericenter passage, and ≈0.1 T prior to apocenter passage (bottom). The curves with arrows are streamlines of the gas velocity projected in the r-θ plane (different streamline colors are used to enhance the contrast against the density color-map). The waves excited by the secondary propagate inward, stirring the vertical and radial motion of the gas.
Current usage metrics show cumulative count of Article Views (full-text article views including HTML views, PDF and ePub downloads, according to the available data) and Abstracts Views on Vision4Press platform.
Data correspond to usage on the plateform after 2015. The current usage metrics is available 48-96 hours after online publication and is updated daily on week days.
Initial download of the metrics may take a while.