Open Access
Fig. 3
Download original image
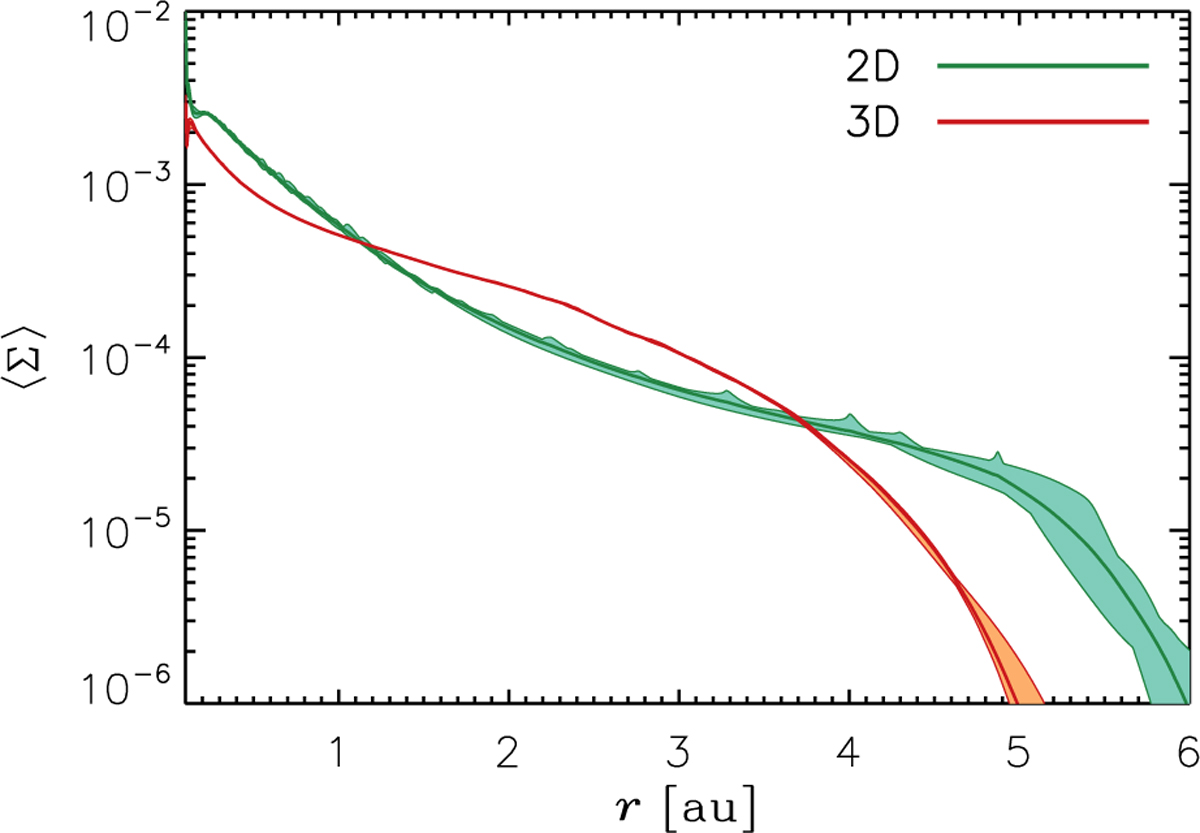
Surface density averaged around the primary, in units of MA/au2, obtained from the 3D (red) and 2D (green) models of Figure 1. The thicker curves represent the mean profile computed over an orbital period of the binary, T. The shaded regions indicate maximum and minimum density values attained during the orbit.
Current usage metrics show cumulative count of Article Views (full-text article views including HTML views, PDF and ePub downloads, according to the available data) and Abstracts Views on Vision4Press platform.
Data correspond to usage on the plateform after 2015. The current usage metrics is available 48-96 hours after online publication and is updated daily on week days.
Initial download of the metrics may take a while.