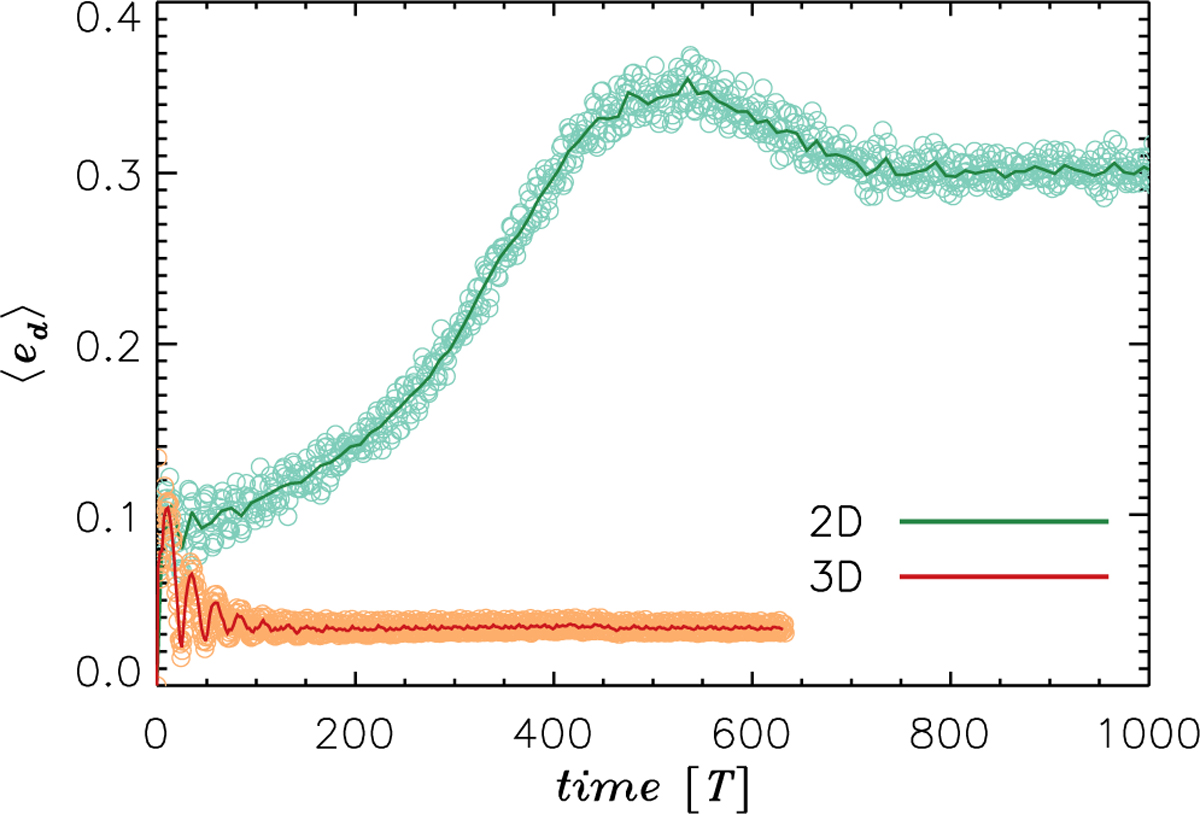
Fig. 4
Download original image
Mass-weighted disk eccentricity, Eq. (4), of the circumprimary disk versus time. The 2D model predicts an eccentric disk, achieving quasi-equilibrium at ⟨ed⟩ ≈ 0.3 (green circles). The solid line is an average performed every 10 T. In comparison, the 3D model predicts a much less eccentric circumprimary disk (orange circles), ⟨ed⟩ ≈ 0.03. The red curve represents an average over 10 T intervals.
Current usage metrics show cumulative count of Article Views (full-text article views including HTML views, PDF and ePub downloads, according to the available data) and Abstracts Views on Vision4Press platform.
Data correspond to usage on the plateform after 2015. The current usage metrics is available 48-96 hours after online publication and is updated daily on week days.
Initial download of the metrics may take a while.