Fig. 6
Download original image
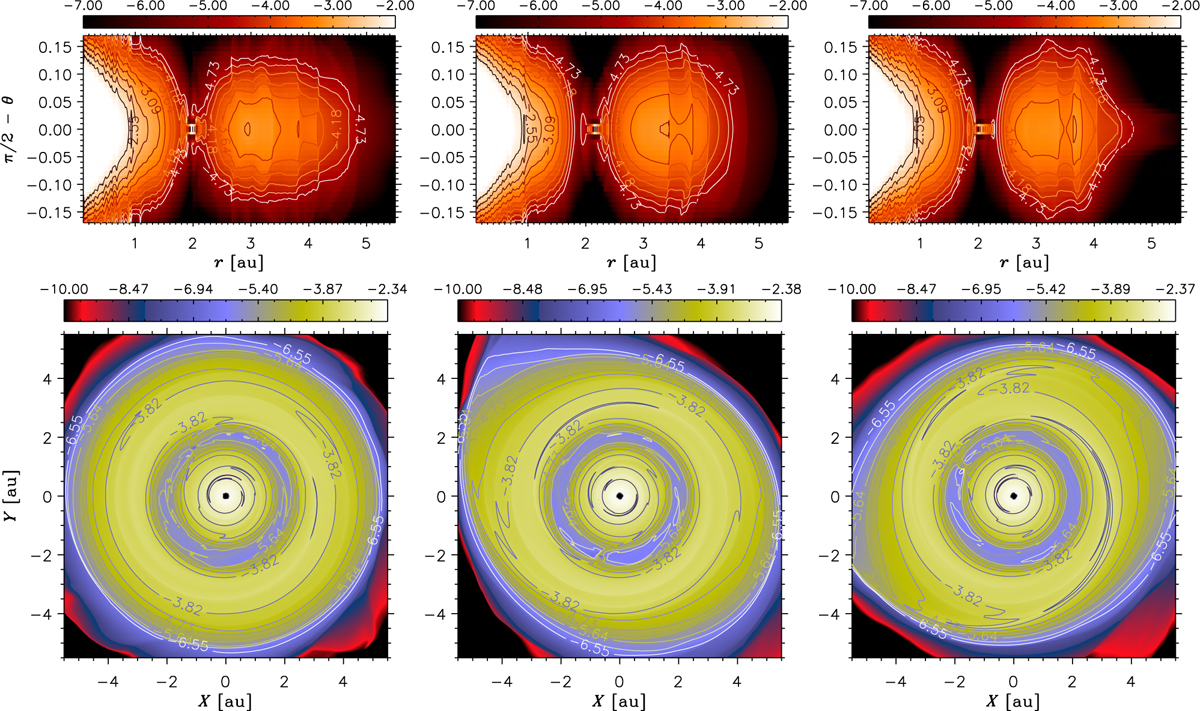
Top panels: volume gas density in vertical slices, in units of MA/au3 and logarithmic scale, obtained from a 3D model that includes a giant planet. Each slice passes through the planet location. The distributions are displayed at a binary phase around apocenter passage (left), pericenter passage (center), and shortly thereafter (right). Bottom panels: surface density of the gas, in units of MA/au2 and logarithmic scale, plotted at the same orbital phases as in the top panels.
Current usage metrics show cumulative count of Article Views (full-text article views including HTML views, PDF and ePub downloads, according to the available data) and Abstracts Views on Vision4Press platform.
Data correspond to usage on the plateform after 2015. The current usage metrics is available 48-96 hours after online publication and is updated daily on week days.
Initial download of the metrics may take a while.