Fig. 8.
Download original image
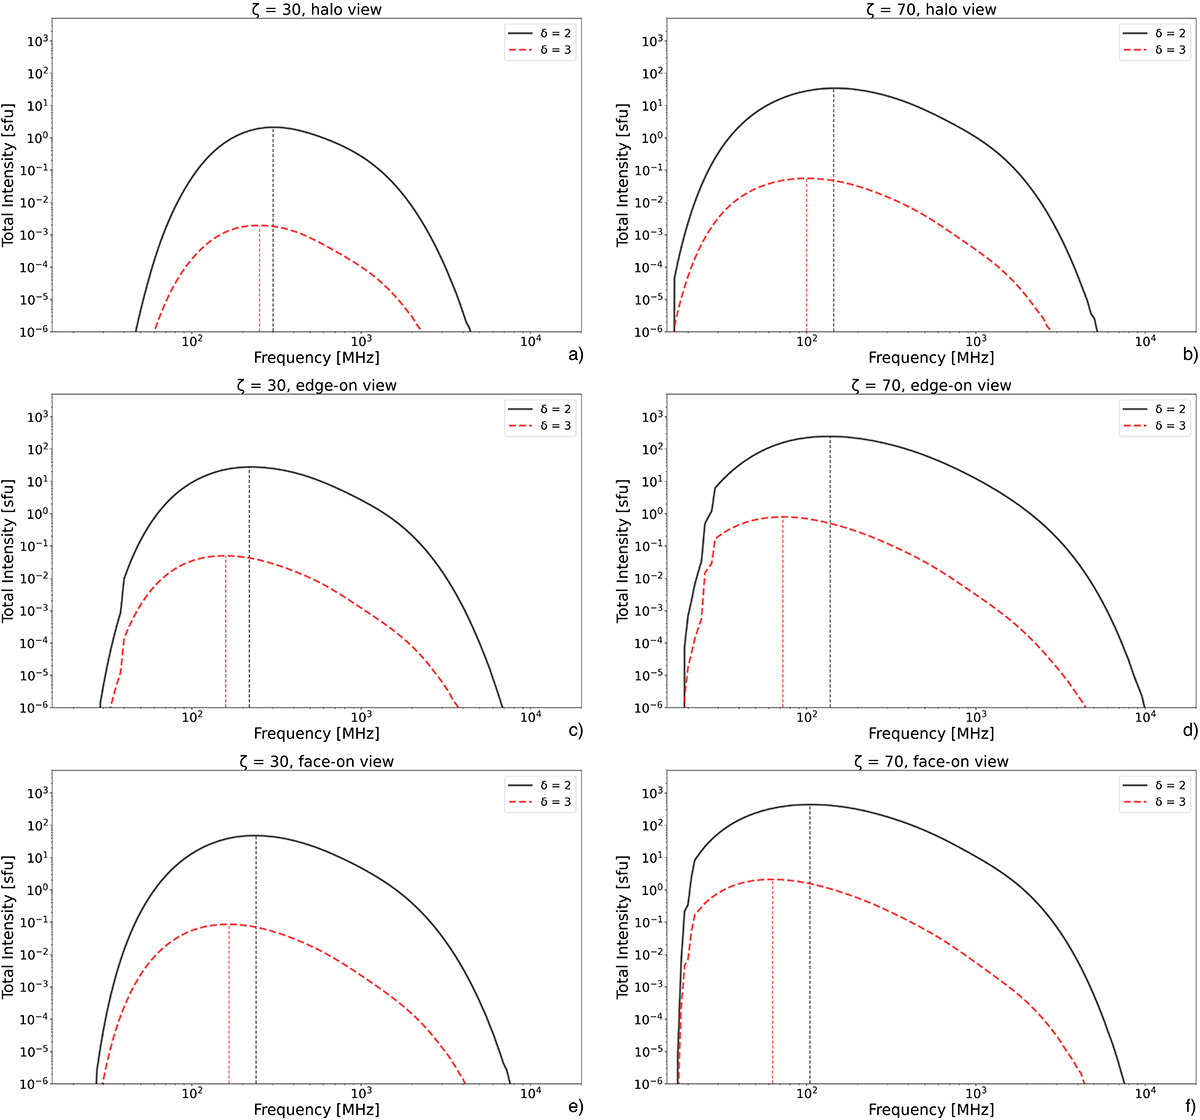
Intensity curves as a function of frequency for a single time. The panels in the left column show the emission spectra in the case ζ = 30 of the electrons injected with spectral indices δ = 2 (black solid line) and δ = 3 (red dashed line). In contrast, the right column depicts the equivalent results in the case ζ = 70. Vertical lines mark the roll-over (or peak) frequencies. All spectra were recorded approximately 32 minutes into the simulation, which is about 3 minutes after the injection of the electrons.
Current usage metrics show cumulative count of Article Views (full-text article views including HTML views, PDF and ePub downloads, according to the available data) and Abstracts Views on Vision4Press platform.
Data correspond to usage on the plateform after 2015. The current usage metrics is available 48-96 hours after online publication and is updated daily on week days.
Initial download of the metrics may take a while.