Open Access
Fig. A.1.
Download original image
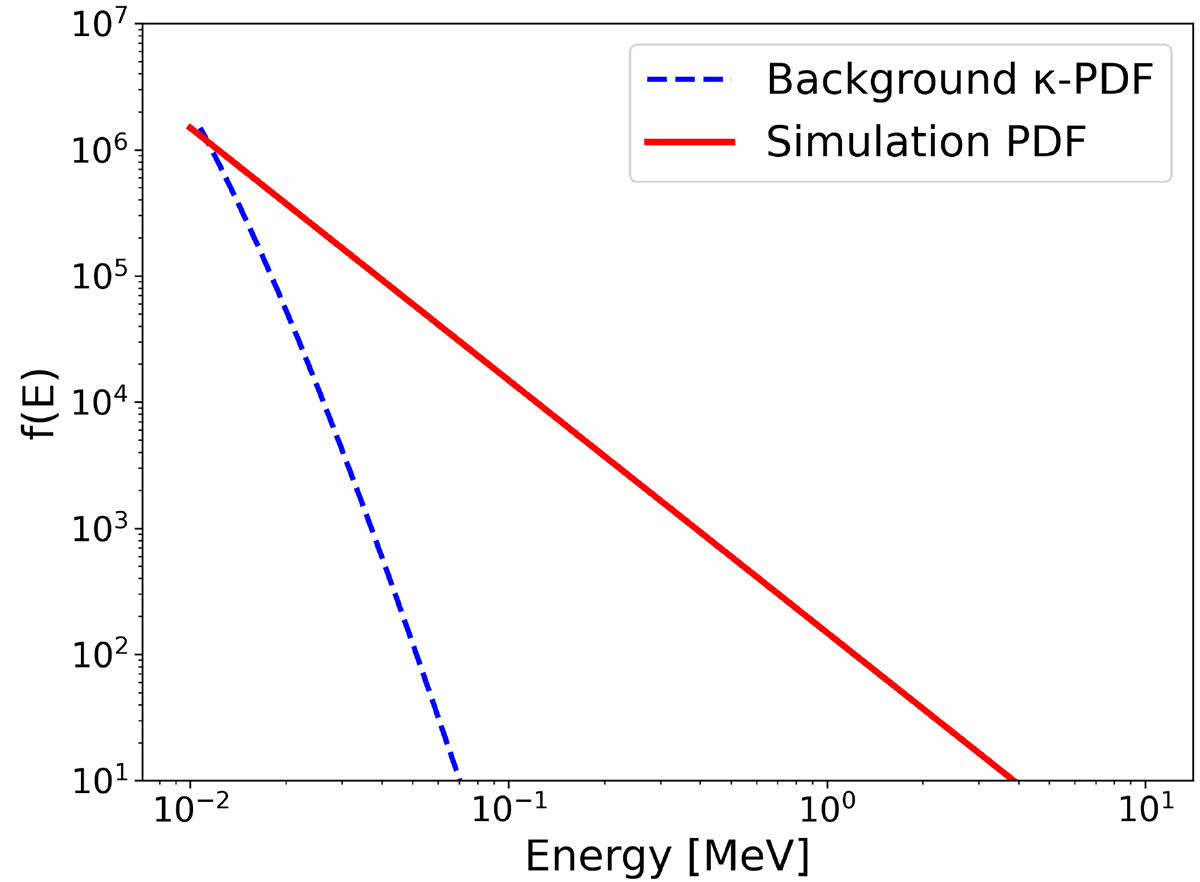
Comparing the distribution function tails of the background and the injected electron distribution. The particle distribution function (PDF) is plotted as a red solid graph, while the background rRKD with κ = 8 and ξ = 0.001 is plotted as a blue dashed graph.
Current usage metrics show cumulative count of Article Views (full-text article views including HTML views, PDF and ePub downloads, according to the available data) and Abstracts Views on Vision4Press platform.
Data correspond to usage on the plateform after 2015. The current usage metrics is available 48-96 hours after online publication and is updated daily on week days.
Initial download of the metrics may take a while.