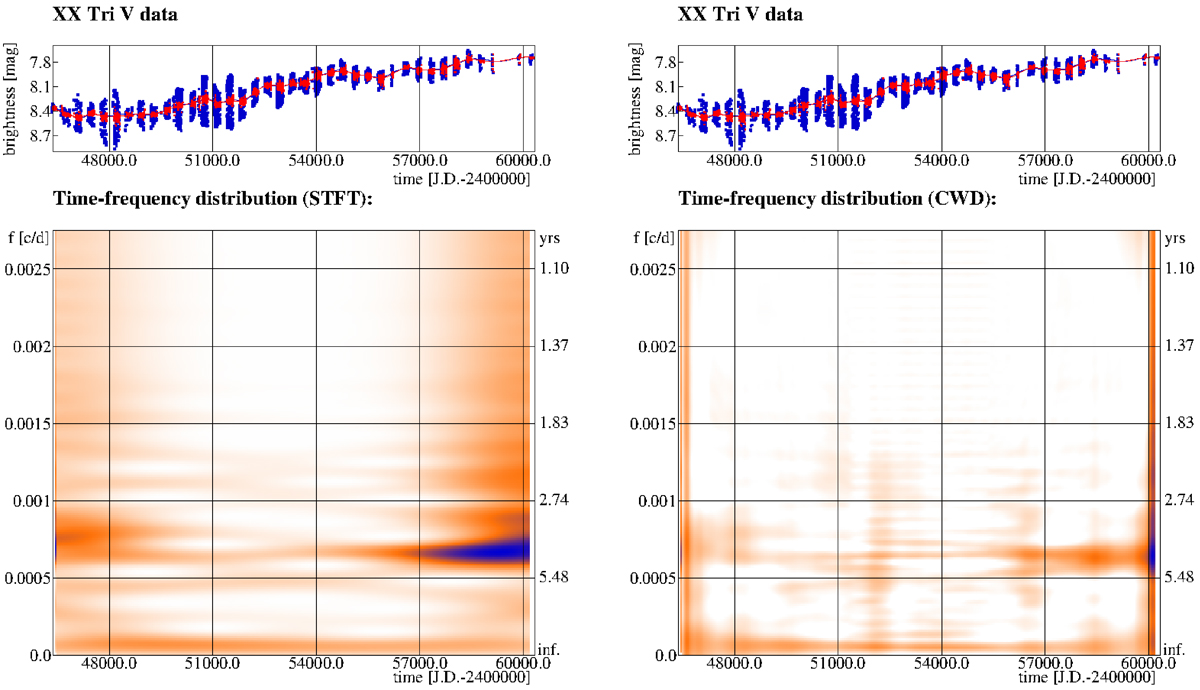
Fig. 3.
Download original image
Time-frequency plot of long-term variability of XX Tri over four decades using STFT (lower left panel) and CWD (lower right panel) kernels. In the two upper (in this case identical) panels, the blue dots show the original V magnitudes, and the blue line shows their spline fit, while the red dots represent the data cleaned of the rotational signal, and the red line represents the corresponding spline fit.
Current usage metrics show cumulative count of Article Views (full-text article views including HTML views, PDF and ePub downloads, according to the available data) and Abstracts Views on Vision4Press platform.
Data correspond to usage on the plateform after 2015. The current usage metrics is available 48-96 hours after online publication and is updated daily on week days.
Initial download of the metrics may take a while.