| Issue |
A&A
Volume 701, September 2025
|
|
|---|---|---|
| Article Number | A103 | |
| Number of page(s) | 11 | |
| Section | Stellar structure and evolution | |
| DOI | https://doi.org/10.1051/0004-6361/202555542 | |
| Published online | 04 September 2025 | |
Four decades of photometry of XX Trianguli, ‘the most spotted star’ in the sky
1
Konkoly Observatory, HUN-REN Research Centre for Astronomy and Earth Sciences, Konkoly Thege út 15-17., H-1121 Budapest, Hungary
2
HUN-REN RCAES, MTA Centre of Excellence, Budapest, Konkoly Thege út 15-17., H-1121 Budapest, Hungary
3
Leibniz-Institute for Astrophysics Potsdam (AIP), An der Sternwarte 16, D-14482 Potsdam, Germany
4
Institute for Physics and Astronomy, University of Potsdam, Karl-Liebknecht-Strasse 24/25, D-14476 Potsdam, Germany
5
Tennessee State University, Nashville, TN, 37209
USA
⋆ Corresponding author: This email address is being protected from spambots. You need JavaScript enabled to view it.
Received:
16
May
2025
Accepted:
22
July
2025
Abstract
Context. Over the past 40 years the brightness variations of XX Tri, a single-line RS Canum Venaticorum (RS CVn)-type binary system with a synchronised K-giant primary, has exceeded one magnitude in the V band. Although these changes are primarily caused by starspots, an additional activity-related mechanism may also be behind the long-term trend of overall brightness increase.
Aims. By compiling the most complete photometric data set so far, we attempt to examine how the nature of seasonal-to-decadal changes can be linked to global magnetism.
Methods. To find the long-term activity cycles and their properties a time-frequency analyser code is used. We divided the entire data set into four consecutive intervals, for which we separately determined the Fourier spectra around the orbital period. This is performed with a Fourier-transformation-based frequency analyser tool.
Results. The long-term brightening of XX Tri was accompanied by a gradual increase in the effective temperature, which resulted in a blueing shift in the Herzsprung-Russell diagram. In the long term, a constant cycle of about four years is most strongly present in the entire data. We also found a modulation of about 11 years and a slowly decreasing cycle of about 5.7–5.2 years. From the seasonal datasets, we found that the most dominant rotation-related periods are scattered around the orbital period. From this we infer a solar-type surface differential rotation, although the surface shear is significantly smaller than that of the Sun.
Conclusions. The four-year cycle indicates flip-flop-like behaviour; during this time, the two-to-three active longitudes usually present on the stellar surface are rearranged. The magnitude range changes in the long term cannot be interpreted solely as changes in the number and size of spots; the unspotted brightness of XX Tri has also increased over the decades. This should alert users of photometric spot models to reconsider the basic concept of constant unspotted brightness in similar cases.
Key words: stars: activity / stars: late-type / stars: individual: XX Tri / starspots
Retired.
© The Authors 2025
 Open Access article, published by EDP Sciences, under the terms of the Creative Commons Attribution License (https://creativecommons.org/licenses/by/4.0), which permits unrestricted use, distribution, and reproduction in any medium, provided the original work is properly cited.
This article is published in open access under the Subscribe to Open model. This email address is being protected from spambots. You need JavaScript enabled to view it. to support open access publication.
1. Introduction
Dark starspots, first mentioned by Kron (1947), are a long-known feature of cool stars with convective envelopes. A characteristic subgroup of these stars is RS Canum Venaticorum (RS CVn) variables, which are close binaries with a cool component showing chromospheric activity (e.g. starspots). Behind the magnetic activity is the dynamo mechanism, which is essentially activated by the convection of conductive plasma and the rotation of the star. Fast rotation is one of the important conditions for amplifying magnetic activity. In the case of RS CVn-type stars with an active cool giant component, the binarity plays a prominent role, namely that in such close binary systems, due to the tidal synchronization, the rotation of the star remains fast, even though blowing up to a giant star would just slow down the rotation. However, tidal forces in such systems not only help maintain fast rotation, tidal interactions are supposed to modify the operation of magnetic dynamo itself (Holzwarth & Schüssler 2003a,b). Such a manifestation occurs, for example, when active longitudes form at certain phases fixed to the orbit (e.g., Oláh 2006). On the other hand, in RS CVn binaries, the magnetic activity can feed back on the orbital dynamics, causing orbital period changes on the timescale of the activity cycle, as described by the Applegate mechanism (Applegate & Patterson 1987; Applegate 1992). Therefore, it is no exaggeration to say that RS CVn-type stars represent an astrophysical laboratory for studying the effect of binarity on activity and vice versa.
Cool starspots typically cause brightness changes of a few tenths of a magnitude due to the rotation of the active component in an RS CVn system. Although the contribution of the bright faculae is only a small fraction of the total rotational brightness change (in shorter wavelength passbands), in some cases a facular network should be taken into account in order to interpret the so-called colour anomaly, when the increasing surface temperature in shorter wavelengths (e.g. in B passband) tends to ’compensate’ for the colour change due to cool spots (Spruit & Weiss 1986; Pettersen et al. 1992).
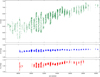 |
Fig. 1. Combined V, B − V and V − IC data of XX Tri that we used in this paper. |
The dynamo mechanism operating in the background, which produces starspots and other surface structures, causes changes not only on a rotational but also on a decadal timescale, just like the solar dynamo (although at a different level). Oláh et al. (2014) investigated three overactive spotted K giants (IL Hya, XX Tri, and DM UMa), all of which are members of RS CVn binaries, whose brightness changes are also significant on rotational and longer timescales. Such significant changes in brightness on both timescales cannot be explained simply by putting a mixture of dark spots and bright faculae on the surface. In the cited paper, the authors concluded that the anomalous brightness change on the decadal scale can be explained by a change of few percent in the size of the star due to the strong and changing global magnetic field during the activity cycle. However, except in the case of IL Hya, this possible explanation has not yet been confirmed.
In the most extreme case of XX Tri, the rotation-related photometric amplitude reached 0.6 mag in Johnson V (Nolthenius 1991), which not only required extremely large and cool spots, but also the distribution of the spots on the stellar surface had to be uneven along the rotational phase (for different approaches to light-curve modelling, see Strassmeier & Oláh 1992 and Hampton et al. 1996). In addition, over the past 40 years the long-term peak-to-peak brightness variation of XX Tri has exceeded one magnitude in V (see Fig. 1). According to this, XX Tri deserves the title of ’the most spotted star’ in the sky. Our present study is dedicated to study the long-term photometric behaviour of this particularly interesting target.
XX Tri (=HD 12545) is a long-period RS CVn system of a bright (Vbr = 7.64 mag) K0III active primary component. Its orbital period of ≈23.97 days (Bopp et al. 1993; Künstler et al. 2015) is very close to the photometric period around 23.9±0.2 days attributed to starspots on the rotating stellar surface; that is, the system is synchronized. The star, which is otherwise a single-lined spectroscopic binary with an unseen (most probably M-type main sequence) secondary component, has long been known for its strong Ca II H&K emission (Bidelman 1985; Montes et al. 1995). Spectroscopic monitoring of XX Tri showed its Hα line consistently in emission (Strassmeier et al. 1990; Bopp et al. 1993; Montes et al. 1997), suggesting an extremely high level of chromospheric activity. Accordingly, XX Tri is also a bright target in the ultraviolet (Bopp et al. 1993; Cardini et al. 2003) and possesses a luminous X-ray corona (Dempsey et al. 1997). The lithium abundance was found to be moderately strong, A(Li)≈1.7, supporting that XX Tri is a He-core-burning red giant branch (RGB) star at the evolutionary stage that can be linked to lithium enrichment (see e.g. Charbonnel & Balachandran 2000; Kumar et al. 2011; Li et al. 2024). Moreover, according to Casey et al. (2019) lithium enrichment can even be related to binarity (on the other hand, see Jorissen et al. 2020).
Based on precise UBV(RI)C photometric measurements from 1991, Strassmeier & Oláh (1992) modeled a huge (ΔV ≈ 0.5 mag) rotational variability caused by cool starspots. Unspotted brightness was chosen as the brightest value measured up to that time; that is, V = 8.11 mag (Nolthenius 1991). From the 0.12-mag large-amplitude V − I colour index, Strassmeier & Oláh (1992) derived a spot temperature of −1100 K relative to the assumed unspotted surface of 4820 K. Also, the spectral type was specified as K0III, instead of G5IV as listed earlier in Strassmeier et al. (1988). The derived spot coverage, however, was so large that the spot model essentially reached the limit where the visible stellar surface barely had any room left to account for the large rotation amplitude and the overall long-term brightness change together. If the unspotted V brightness was chosen to be only a few tenths of a magnitude brighter, it would not have been possible to obtain any suitable spot model for the observed light curve. We note here that, with the knowledge of the subsequent brightening of the star (more details are given later in this paper), the assumption that there would be an ‘unchanged’, unspotted brightness value over time is obviously not tenable.
The first Doppler image of the star was presented by Strassmeier (1999) from 1997-98, the season characterised by high-amplitude changes in brightness. For the extreme rotational variability, the Doppler reconstruction required a gigantic high-latitude cool spot, but also bright areas in the opposite hemisphere. The star’s then-record brightness and record photometric amplitude were reminiscent of the solar activity, in that our Sun is also the brightest when the degree of spot coverage is the greatest (i.e. at the maximum of the solar cycle).
In our subsequent, more extensive Doppler study (Künstler et al. 2015), we managed to obtain 36 Doppler images based on continuous spectroscopic observations spanning six years, collected with the help of the STELLA robotic observatory in Tenerife, Spain. According to the study, the surface of XX Tri was covered by large, high-latitude, and even polar spots and occasionally smaller equatorial spots. Furthermore, based on the time-series Doppler images it was possible to monitor the morphological changes of the spots. The measured spot decay rate provided a basis for estimating the turbulent diffusivity. However, since it was not possible to separate the opposite processes occurring together (i.e. spot decay and formation), the derived value of the turbulent diffusivity may require revision.
In our last work (Strassmeier et al. 2024, hereafter Paper I), we presented a time series Doppler imaging study of XX Tri, covering 16 years (2006–2022, including the six years’ of data from the previous study). From this most comprehensive Doppler imaging study so far, in which 99 images were reconstructed from the same target, it was concluded that i) the stellar dynamo working in the background is aperiodic, likely chaotic in nature; ii) the Doppler images indicate ‘missing’ (i.e. blocked) flux due to cool spots of up to 10% of the total flux, which is redistributed on a global scale, contributing to an increase in the effective temperature on a longer timescale; and iii) the rotation-induced stellar photocentre variations due to starspots pose an intrinsic limitation for astrometric exoplanet catches. However, the Doppler study covers less than half of the available photometric time series, overlapping essentially with the most recent period during which XX Tri is in its brightest state. In comparison, at the very beginning of the systematic photometric observations, the star was fainter by about 0.65 mag in V on average, while its rotation amplitude was three-to-four times that of today. This significant difference can definitely be linked to the change in processes related to global magnetism over decades; that is, to the change in dynamo operation. Therefore, in the present work, we focused on the analysis of the most complete long-term photoelectric photometric datasets available from the past approximately four decades, obtained mostly with automatic photoelectric telescopes (hereafter APTs). Below, we adopt the most thorough summary of the stellar parameters so far from Paper I, which we list in Table 1.
Relevant astrophysical data of XX Tri adopted from Paper I.
This paper is organised as follows: we present our available photometric data in Sect. 2 and the methods used in Sect. 3. The seasonal photometric period changes are analysed in Sect. 4.1, long-term cycles are investigated in Sect. 4.2, while the long-term colour changes are presented and interpreted in Sect. 4.3. Our basic results are discussed in Sect. 5 and summarised in Sect. 6.
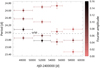 |
Fig. 2. Rotational periods of XX Tri for four segments of V dataset. The orbital period is indicated with a dashed line. The dots marking the detected rotational signals of each segment are coloured according to their Fourier amplitudes (see also Table 2). |
Seasonal rotational periods and their corresponding Fourier amplitudes.
2. Observations
For our study, we attempted to collect all available photometric data concerning XX Tri. All published photometric data from the literature were gathered and used. Sources of the observations up to 1996 are listed in Strassmeier et al. (1997); see their Table 5, and the corresponding data can be found in the VizieR online catalogue of the Strasbourg astronomical Data Center (CDS). Unpublished data referred to as a ‘private communication’ in the above paper, including the UBV(RI)C data from the Konkoly Observatory, have been uploaded to the VizieR catalogue as a supplement to this paper.
Most of the B, V observations were made by the Tennessee State University T3 0.41-m Automated Photometric Telescope (APT) located at Fairborn Observatory, Arizona, USA (Henry 1995); this series of observations ended in 2024. The V observations made between October 1990 and February 2015 were published in Jetsu et al. (2017). Now, all XX Tri data from T3 are compiled and uploaded in the VizieR online catalogue.
Fairborn Observatory gave place to two more APTs used for XX Tri photometry, the Wolfgang (T6) and Amadeus (T7) 0.75-m automatic twin telescopes, which were jointly operated initially by the University of Vienna and later by Leibniz-Astrophysical Institute Potsdam (AIP). The Wolfgang photometer is optimised for Strömgren uvby. The Amadeus photometer is optimised for the Johnson BVR system. The Wolfgang system was available for XX Tri from 1997 to 2009. Unfortunately, however, the photometric performance of Amadeus was not satisfactory in the following ten years either. After the cathode tube was replaced with a blue-sensitive one on 13 January 2018 (JD 2458132), the system performed better for a short time, but it faded again shortly afterwards. The telescope finally ended its operation in January 2019. We note that the photometric data collected with the T6-T7 telescopes are already published in a supplement to Paper I.1
The combined most complete V, B − V and V − IC data of XX Tri are shown in Fig. 1. To convert differential measurements to absolute scale, HD 12478 was used as a comparison star with magnitudes  78, B − V = 1
 45, and V − IC = 1
 38.
38.
3. Methods
3.1. Period search by MuFrAn
The period search analysis of the light curves is partially performed with the Multi-Frequency Analyzer code (MuFrAn, Csubry & Kolláth 2004). This Fourier-transformation based frequency analyser tool is suitable for searching for multiple periods in unevenly sampled time series and displaying the results graphically. We used MuFrAn to investigate fluctuations in the rotation period over several seasons (Sect. 4.1).
Looking for the possible variability of the rotational modulation, first, the high amplitude, long-term changes were simultaneously refined using a discrete Fourier transform (DFT; Deeming 1975) and removed from the data. The dataset pre-whitened in this way was analysed again in its full length and then divided into separate subsets. We note that pre-whitening is not of great importance in our case, as it has no effect in the frequency range typical of the rotation.
3.2. Time-frequency analysis by TiFrAn
To find the activity cycles and their properties, the Time-Frequency Analysis program package (TiFrAn, Kolláth & Oláh 2009) was used. Since the amplitude of the rotational modulation shown by the observations were grossly variable, exceeding 0.6 magnitudes sometimes, we removed the rotational signals from the unevenly sampled seasonal light curves. This way, we were able to avoid false signals in the analysis targeting decadal variability. The program package can operate with different kernels such as the short-term Fourier transform (STFT) and the Choi-Williams distribution (CWD) kernel, the latter having a better frequency resolution but lower time resolution. A detailed description of the practical application of this tool to long-term time series of stars can be found in Oláh et al. (2009); see their Sect. 3.
4. Results
4.1. Seasonal changes in the rotation period
In the case of spotted stars, a known phenomenon is the temporal change of the rotation signal, which is mostly explained by the changing spot configuration from season to season, as well as differential rotation. It would be desirable to examine the shortest time intervals possible (e.g. annual), but on the other hand, deriving a precise period is only possible in the case of a sufficiently long data series. Since during an annual observing season our data cover roughly 10–12 rotation periods at most, period search for each year is not possible. Instead, we divided the data into four segments of similar length, keeping in mind that no significant changes occur within each segment, in the sense that the trend or ‘dynamics’ of change are roughly ‘constant’ within a segment. With the division according to this principle, the following time intervals were created (HJD − 2400000): 46370–50152 (nearly constant average brightness), 50391–53804 (continuous increase in average brightness), 53995–56244 (average brightness reaches its local maximum and then decreases), and 56555–60327 (slight upward trend in average brightness); see the upper panel of Fig. 1.
The period search was carried out as follows. Using Mufran, we searched for the most dominant rotation-related period from data previously cleaned of long-term trends. The next period search was always performed on the spectrum pre-whitened by the previously found dominant period, and so on until no period of reasonable amplitude remains. The resulting three-to-four periods per season with their respective Fourier amplitudes are listed in Table 2 for all four intervals, which are graphically represented in Fig. 2 in comparison with the orbital period.
We note that in the classical approach, according to the uncertainty principle, ΔwΔt≥1 relation applies between the Δw width of the Fourier signal and the Δt length of the dataset. Based on this, the uncertainty of the Fourier signals obtained for the different seasons (frequency converted to days) would be on the order of ∼0.15–0.20 d. However, this value overestimates the more realistic uncertainties that can be derived from the peak widths measured at 90% heights of the peaks in the amplitude spectra (see Oláh et al. 2003). In comparison with the obtained periods and their associated errors, we also present the Lomb-Scargle periodograms obtained for the entire V data and the four sub-seasons in Appendix A. The most dominant periods in Fig. 2 scatter around the orbital period, while those with smaller amplitudes usually diverge more. Possible reasons for this are discussed in Sect. 5.
4.2. Long-term brightness changes
A long-term, cycle-like brightness variation with a characteristic timescale of about four years’ of XX Tri was derived for a 21-year long dataset by Oláh et al. (2009) using TiFrAn. The present photometric dataset now spans four decades, for which we repeated the time-frequency analysis. First, the rotational modulation was removed from the data since the uneven distribution of the measured datapoints and the sometimes very high amplitude could alter the seasonal variations giving rise to possible false long-term signals. The result of the long-term variability with STFT is plotted in the left panel of Fig. 3, while that obtained using a CWD with better frequency but poorer time resolution is seen in the right panel of Fig. 3. Apart from the visible, very-high-amplitude brightening on a time span of ∼40 years, a modulation of the order of ≈11 years, a slowly decreasing cycle between ≈5.7–5.2 years, and a constant cycle of about four years are present in the data throughout the observations, the latter being the strongest signal of all.
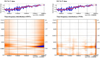 |
Fig. 3. Time-frequency plot of long-term variability of XX Tri over four decades using STFT (lower left panel) and CWD (lower right panel) kernels. In the two upper (in this case identical) panels, the blue dots show the original V magnitudes, and the blue line shows their spline fit, while the red dots represent the data cleaned of the rotational signal, and the red line represents the corresponding spline fit. |
4.3. Migration on the HRD
A long-term BVIC dataset was used to trace the temperature changes on the surface of XX Tri. The bulk of the dataset consists of independent series in B, V and V, IC colours by different automated telescopes (see Sect. 2) and is supplemented by a small amount of data gathered from other sources. As Fig. 5 shows, the agreement between the two sets of V measurements made by different telescopes is excellent, apart from an approximately 0 05 discrepancy between HJD 2455478 and 2455970; the reason for this is unknown to us. This, however, translates to an approximately 80 K temperature difference, which is not negligible. The right panel of Fig. 5 shows the shifted V data and the corresponding shifted V − IC values (all of the original colour index data are shown in Fig. 1).
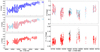 |
Fig. 5. Left, from top to bottom: B, V, and IC data used for temperature determinations. In the middle panel showing V data, points measured simultaneously with B measurements are marked in light blue, and points measured simultaneously with IC measurements are marked in light red. Right: Enlarged view around discrepant V (upper panel) and V − IC (lower panel) data; data points corrected by 0 |

The colour-index data (B − V, V − IC) were corrected for interstellar extinction to define temperatures. To obtain the extinction parameter, we accessed the 3D dust maps of interstellar dust reddening2 (Bayestar17, Green et al. 2018). According to the best-fit distance-reddening curve, we adopted a colour excess of  (cf. Fig. 4 in Oláh et al. 2014), along with E(V − IC)/E(B − V) = 1.25 from Fitzpatrick (1999).
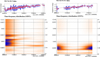 |
Fig. 4. Time-frequency plot of long-term variability of XX Tri over nearly four decades in B − V (left panels) and V − IC colour indices (right panels). Otherwise, as in Fig. 3. |
Surface temperatures were estimated using the empirical colour-temperature calibration of Worthey & Lee (2011) by interpolating their table to the measured colour index values corrected for the interstellar extinction and the surface gravity (log g = 2.82) and metallicity ([Fe/H] = −0.13). For the second half of the available colour-temperature data, we have surface-temperature values obtained from spectral synthesis of 1822 spectra (Paper I). The results are plotted in Fig. 6.
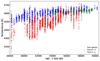 |
Fig. 6. Comparison of overall stellar temperature variations derived from STELLA spectra used in Paper I (green crosses) and from B − V (blue dots) and V − IC colour indices (red dots). |
The substantial variability of the surface temperature of the order of about 500 K seen in Fig. 6, apart from the interstellar extinction, affects the position of XX Tri in the HRD, as was already shown in Oláh et al. (2014). Here, we present stellar surface temperatures derived from B − V and V − IC colour indices. The paths of the star on the HRD during the course of the decades-long variation according to the two series of temperature values are plotted in Fig. 8.
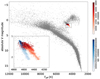 |
Fig. 8. Change of location of XX Tri on HRD due to temperature variation derived from B − V (bluish shades) and V − IC (reddish shades). The passage of time is indicated by the colour scales on the side. |
5. Discussion
5.1. Long-term periods
It is widely known that in (otherwise usually tidally locked) RS CVn systems, activity cycles are typically anharmonic (e.g. Lanza 2010 and references therein), and in many cases, multiple and variable quasi-cycles can be found (Oláh et al. 2009). The photometric data of XX Tri perfectly support this observation: we see a main ∼4-year cycle that varies slightly over time, as well as an ∼7-year cycle that appears spectacularly in the V − IC colour index, and, although weaker, it is also partially present in the B − V data (see Fig. 4). In the latter (longer) data series, an ∼11-year cycle can also be detected. We note that the only cycle-like variation found earlier by Oláh et al. (2009) in their 21-year-long photometric dataset was 3.8 years long, very close to our ∼4-year main cycle. We also note that, even though the B − V and V − IC colour-index data are five and 12 years shorter, respectively, than the full set of V observations, the cycle timescales and the time-frequency patterns revealed are very similar to those found in the V data (see Figs. 3 and 4).
In our recent spectroscopic analysis covering 16 years (Paper I), we found a cycle period of 1514 ± 83 days (≈4.1 yr) in the effective temperature change. The coincidence of the ∼4-year cycle found in the long-term brightness with this 4.1-year period is striking, which is also supported by the agreement with the cycles of similar lengths found in the B − V and V − I colour indices, respectively; see Figs. 6 and 7. This mid-term cycle of ∼4 years does not appear to be closely affected by the longer term observed trends as seen in the V data. In other words, this ∼4-year cycle does not show any significant change with the total spot coverage, one only needs to take a look at the huge amplitude brightness changes characteristic of the first half of the photometric observations. In this regard, we suspect that this cycle is likely the result of a flip-flop-like phenomenon; that is, a longitudinal rearrangement of large spots rather than a large-scale trend reversal in total spottedness.
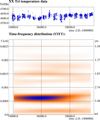 |
Fig. 7. Variability over 16 years’ of spectroscopically determined effective temperature of XX Tri taken from Paper I. Otherwise, as in Fig. 3. |
Based on the most comprehensive Doppler imaging study ever applied to a spotted star, also covering the longest period of time so far, that is, the 16-year-long time-series Doppler imagery of XX Tri in Paper I (see Fig. 2 and the supplementary movies in Strassmeier et al. 2024), it appears that two-to-three activity centres (active longitudes) are typically present at any given time. The positions of these change slowly but continuously. That is, they are not closely tied to the orbital phase. To examine this in more detail, we performed the following study. Based on the time-series Doppler images, we calculated the longitude values around which the spots were grouped (active longitudes). For this, we prepared a distribution function of the spot-filling factor, f, along the longitude scale for each temperature map (for details on how to calculate f, see Eq. (5) in Kővári et al. 2024). The longitudinal values of the first and second (and if relevant, the third) maxima of the histograms were considered active longitudes. The changes of these active longitude values over 16 years are shown in Fig. 9. In the figure, active longitudes appear as separate strings of dots, which can be followed for three-to-eight seasons, depending on their lifespan. A relatively constant drift is noticeable (especially from the second half of the 16 years covered, with a slope of about 0.12° day−1), which is due to the difference between the dominant photometric period and the orbital period, and from which it appears that there are no activity centres bound to the orbit. It is also clear that the structures characteristic of the period between the fourth and eighth seasons differ significantly from those of the periods before and after it. The average lifetime of the active longitudes together with the characteristic timescale of the global changes reflected in Fig. 9 support that the roughly four-year mid-term cycle may indeed be related to significant rearrangements of the spots, that is, a flip-flop-like behavior.
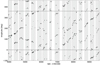 |
Fig. 9. Longitudes of activity centres derived from 16 years’ of time-series Doppler images. We identified two or three activity centres per image. The larger the dot size, the more dominant the active longitude. Vertical grey bars indicate the separate observing seasons. |
The above, however, suggests a more complex behaviour than simply a swapping of two activity centres located in opposite hemispheres. It is very likely that the underlying dynamo, best represented by a chaotic oscillator (see Spiegel 2009; Arlt & Weiss 2014, etc.) has complex nonlinear feedback mechanisms, although their characteristics are not precisely known, not only for stellar dynamos, but even for the solar dynamo. With all this, the main conclusion of Paper I that the long-term surface activity of XX Tri is mostly chaotic in nature can be maintained.
5.2. Seasonal period changes and differential rotation
Based on the period search presented in Sect. 4.1, it becomes clear that some slightly different, but certainly rotationally induced, periods are simultaneously present. The most obvious explanation for this phenomenon is that the star rotates differentially, while the starspots from which the rotation signals come are located at different astrographic latitudes. Accordingly, the  value calculated from the ΔP interval of the different rotation periods and their
  average gives a reasonable estimate to the surface shear parameter α = (Ωeq − Ωpol)/Ωeq, which is calculated from the equatorial (eq) and poloidal (pol) angular velocities, characterising the differential rotation. Using the values in Table 2 yields
  0.05, supporting the general picture emerging from previous experiences (e.g. Petit et al. 2004; Marsden et al. 2007; Weber 2007; Özdarcan et al. 2016; Xiang et al. 2024) that the surface differential rotation for active giants in tidally bound RS CVn systems is typically larger than that seen in rapidly rotating dwarfs, but it reaches neither that of single giants with similar rotation rates nor the value measured for the Sun (see the comprehensive study by Kővári et al. 2017a).
If we compare the values of Table 2 with the overall brightness changes presented in Fig. 1, it is seen that, moving forward in time, in the second half of the observations, smaller amplitude changes associated with higher average brightness typically have shorter rotation periods (see Fig. 2). This can be interpreted as follows. At medium inclination (∼60°, as in the case of XX Tri), spots closer to the visible pole result in greater spot coverage (greater average brightness decrease), but also a smaller brightness variation amplitude; however, at lower latitudes, spots may even disappear at some phases during rotation, so they mainly increase the amplitude and contribute only slightly to the overall brightness decrease. That is, in the first half of the entire observation period of four decades, the spots were present both at lower latitudes and near or even covering the pole, while in the second half, spots did not cover the pole, they appeared at mid-latitudes. This can be brought into line with the assumption of solar-like differential rotation working on the surface of XX Tri; that is, shorter period signals originate from lower latitudes, while longer ones come from higher latitudes. This assumption is supported by the results of an earlier Doppler imaging study and the recent one in Paper I. During the first half of the photometric observations (more precisely, during the high-amplitude period around ∼HJD 2450820; i.e. 1998), the only reconstructed Doppler image revealed a huge asymmetric polar cap (Strassmeier 1999), while the time-series Doppler imaging study in Paper I, in which the spectroscopic data essentially overlap with the second half of the photometric data, shows that the centroids of the spots are typically located around latitudes between 45° and 65°, but the spots do not extend far enough to cover the visible pole.
To further confirm the operation of solar-type surface differential rotation on XX Tri, using the time-series Doppler images from Paper I we applied the method of average cross-correlations, a well-established technique dubbed ACCORD (e.g. Kővári et al. 2012, 2015, 2017b) for detecting surface shear on spotted stars. ACCORD combines information from spot displacements on successive Doppler images to detect and measure surface differential rotation. As shown in Fig. 10, the method results in a grand average correlation pattern clearly indicating a weak, sun-like shear. Fitting the pattern by a rotation law in the usual form Ω(β) = Ωeq(1 − αsin2β), where Ω(β) is the angular velocity measured at latitude β, yields a value of 0.014±0.003 for the shear coefficient α. We draw attention to the fact that the α value obtained from the time-series Doppler images, although smaller, does not contradict the  0.05 value given above based purely on photometry, as the latter is only a rough estimate of the relative shear. Finally, we note that in our upcoming paper we are preparing to present a more detailed study focusing on the expanded number of time-series Doppler images generated in the meantime and further findings that can be drawn from them (e.g. regarding differential rotation).
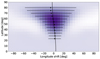 |
Fig. 10. Grand average of cross-correlation function maps obtained from ACCORD. The map indicates how much longitude shift occurs at a given latitude due to surface shear over 35 days (the median time interval between successive Doppler maps). The solid line is a Sun-like differential rotation fit with a shear coefficient of α = 0.014. |
5.3. Spot-dominated magnetic activity
In the past four decades, XX Tri essentially became hotter and bluer, resulting in a gradual displacement in the red clump region of the HRD (see Fig. 8). This global change is spot-dominated, meaning that huge, dark starspots dominate the variability. When we see more spots, the star is fainter overall, unlike the plage-dominated Sun, whose activity is characterized by the exact opposite: the Sun is brightest at spot maximum. Another characteristic feature of spot dominance is that there is an anti-correlation between the rotational light curve and the chromospheric activity indicators (e.g. Ca II H&K lines or Hα emission). We note that this kind of spot dominance is a regular feature of active (sub)giants in long-period RS CVn systems; we only mention the most well-known targets here: II Peg and λ And (Frasca et al. 2008; Adebali et al. 2025), IM Peg (Zellem et al. 2010), V711 Tau (Vogt et al. 1999), σ Gem (Kővári et al. 2001), and ζ And (Kővári et al. 2007; Roettenbacher et al. 2016).
We believe that the significant overall brightness increase of XX Tri observed over the past four decades, together with the colour-index changes, which also cause the displacement of the star on the HRD, are due to strong and variable surface magnetic fields present throughout the intensity variations of surface spot activity (for 2 more examples, see Oláh et al. 2014). All these changes, with the huge amplitudes in the early period, their decreasing magnitude over time, and the gradual brightening, are difficult to interpret; however, we can ascertain that the star’s unspotted temperature has also increased over the past four decades. The likely cause of this is the extensive spot activity itself, which blocks the outward energy flux, which eventually, on a longer timescale, breaks through and manifests itself in a global brightening (cf. Strassmeier et al. 2024; see their Discussion section).
6. Summary and conclusions
This study is a continuation of a series of papers that began with the recently published Paper I, which presented an unprecedented Doppler imaging study of XX Tri, visualising the continuous surface spot evolution for 16 years. In the present ‘Paper II’, we attempted to perform a comprehensive analysis of the star’s four-decade photometric history. Our main conclusions drawn from the results are listed below.
-
The most significant of the longer-term cycles appearing in photometric data series is ≈4 years, which is consistent with the 4.1-year cycle found from independent spectroscopic time series in Paper I. This mid-term cycle apparently has nothing to do with the star’s gradual brightening over several decades. This cycle indicates a rather flip-flop-like behaviour. Compared to the time-series Doppler images of Paper I, it appears that, typically during this time, the two-to-three active longitudes that are usually present on the stellar surface are rearranged.
-
Comparing the seasonal changes in the rotation period with the results of previous Doppler studies suggests that XX Tri performs solar-like surface differential rotation, although the surface shear is significantly smaller than that of the Sun. This is further supported by the weak, Sun-like differential rotation with a shear coefficient of α = 0.014, inferred from a preliminary analysis of the time-series Doppler images from Paper I. Our result is in good agreement with the empirically predicted value for such giant components in RS CVn-type close binary systems.
-
The average brightness of the star gradually increased over the four decades of observation, while the spot coverage and seasonal amplitudes of the brightness variability decreased in general. However, the observed changes cannot be interpreted solely as changes in the number and size of the spots, we must also assume that the surface temperature, and therefore the unspotted brightness, also increased over the decades. This result should prompt users of photometric spot models to reconsider the basic concept of a constant unspotted temperature when interpreting long-term trends in brightness changes of spotted stars.
Data availability
The previously unpublished photometric data of XX Tri used in this paper (listed in Sect. 2) are available at the CDS via https://cdsarc.cds.unistra.fr/viz-bin/cat/J/A+A/701/A103
Available at https://data.aip.de/projects/xx_tri.html
Acknowledgments
The authors gratefully acknowledge the comments and suggestions of the reviewer, Dr S. Gu, which helped improve the paper. This work was supported by the Hungarian National Research, Development and Innovation Office grant KKP-143986. GWH acknowledges long-term support from NASA, NSF, and the Tennessee State University. STELLA was made possible by funding through the State of Brandenburg (MWFK) and the German Federal Ministry of Education and Research (BMBF). The facility is a collaboration of the AIP in Brandenburg with the IAC in Tenerife. This work has made use of data from the European Space Agency (ESA) mission Gaia (https://www.cosmos.esa.int/gaia), processed by the Gaia Data Processing and Analysis Consortium (DPAC, https://www.cosmos.esa.int/web/gaia/dpac/consortium). Funding for the DPAC has been provided by national institutions, in particular the institutions participating in the Gaia Multilateral Agreement.
References
- Adebali, Ö., Strassmeier, K. G., Ilyin, I. V., et al. 2025, A&A, 695, A89 [NASA ADS] [CrossRef] [EDP Sciences] [Google Scholar]
- Applegate, J. H. 1992, ApJ, 385, 621 [Google Scholar]
- Applegate, J. H., & Patterson, J. 1987, ApJ, 322, L99 [NASA ADS] [CrossRef] [Google Scholar]
- Arlt, R., & Weiss, N. 2014, Space Sci. Rev., 186, 525 [NASA ADS] [CrossRef] [Google Scholar]
- Bidelman, W. P. 1985, Int. Amateur-Professional Photoelectric Photometry Commun., 21, 53 [Google Scholar]
- Bopp, B. W., Fekel, F. C., Aufdenberg, J. P., Dempsey, R., & Dadonas, V. 1993, AJ, 106, 2502 [Google Scholar]
- Cardini, D., Cassatella, A., Badiali, M., Altamore, A., & Fernández-Figueroa, M. J. 2003, A&A, 408, 337 [NASA ADS] [CrossRef] [EDP Sciences] [Google Scholar]
- Casey, A. R., Ho, A. Y. Q., Ness, M., et al. 2019, ApJ, 880, 125 [Google Scholar]
- Charbonnel, C., & Balachandran, S. C. 2000, A&A, 359, 563 [Google Scholar]
- Csubry, Z., & Kolláth, Z. 2004, in SOHO 14 Helio- and Asteroseismology: Towards a Golden Future, ed. D. Danesy, ESA Spec. Pub., 559, 396 [Google Scholar]
- Deeming, T. J. 1975, Ap&SS, 36, 137 [Google Scholar]
- Dempsey, R. C., Linsky, J. L., Fleming, T. A., & Schmitt, J. H. M. M. 1997, ApJ, 478, 358 [NASA ADS] [CrossRef] [Google Scholar]
- Fitzpatrick, E. L. 1999, PASP, 111, 63 [Google Scholar]
- Frasca, A., Biazzo, K., Taş, G., Evren, S., & Lanzafame, A. C. 2008, A&A, 479, 557 [NASA ADS] [CrossRef] [EDP Sciences] [Google Scholar]
- Green, G. M., Schlafly, E. F., Finkbeiner, D., et al. 2018, MNRAS, 478, 651 [Google Scholar]
- Hampton, M., Henry, G. W., Eaton, J. A., Nolthenius, R. A., & Hall, D. S. 1996, PASP, 108, 68 [Google Scholar]
- Henry, G. W. 1995, in Robotic Telescopes. Current Capabilities, Present Developments, and Future Prospects for Automated Astronomy, eds. G. W. Henry, & J. A. Eaton, ASP Conf. Ser., 79, 37 [Google Scholar]
- Holzwarth, V., & Schüssler, M. 2003a, A&A, 405, 291 [NASA ADS] [CrossRef] [EDP Sciences] [Google Scholar]
- Holzwarth, V., & Schüssler, M. 2003b, A&A, 405, 303 [NASA ADS] [CrossRef] [EDP Sciences] [Google Scholar]
- Jetsu, L., Henry, G. W., & Lehtinen, J. 2017, ApJ, 838, 122 [NASA ADS] [CrossRef] [Google Scholar]
- Jorissen, A., Van Winckel, H., Siess, L., et al. 2020, A&A, 639, A7 [NASA ADS] [CrossRef] [EDP Sciences] [Google Scholar]
- Kolláth, Zs., & Oláh, K. 2009, A&A, 501, 695 [NASA ADS] [CrossRef] [EDP Sciences] [Google Scholar]
- Kővári, Zs., Strassmeier, K. G., Bartus, J., et al. 2001, A&A, 373, 199 [NASA ADS] [CrossRef] [EDP Sciences] [Google Scholar]
- Kővári, Zs., Bartus, J., Strassmeier, K. G., et al. 2007, A&A, 463, 1071 [NASA ADS] [CrossRef] [EDP Sciences] [Google Scholar]
- Kővári, Zs., Korhonen, H., Kriskovics, L., et al. 2012, A&A, 539, A50 [NASA ADS] [CrossRef] [EDP Sciences] [Google Scholar]
- Kővári, Zs., Kriskovics, L., Künstler, A., et al. 2015, A&A, 573, A98 [NASA ADS] [CrossRef] [EDP Sciences] [Google Scholar]
- Kővári, Zs., Oláh, K., Kriskovics, L., et al. 2017a, Astron. Nachr., 338, 903 [Google Scholar]
- Kővári, Zs., Strassmeier, K. G., Carroll, T. A., et al. 2017b, A&A, 606, A42 [CrossRef] [EDP Sciences] [Google Scholar]
- Kővári, Zs., Strassmeier, K. G., Kriskovics, L., et al. 2024, A&A, 684, A94 [NASA ADS] [CrossRef] [EDP Sciences] [Google Scholar]
- Kron, G. E. 1947, PASP, 59, 261 [NASA ADS] [CrossRef] [Google Scholar]
- Kumar, Y. B., Reddy, B. E., & Lambert, D. L. 2011, ApJ, 730, L12 [NASA ADS] [CrossRef] [Google Scholar]
- Künstler, A., Carroll, T. A., & Strassmeier, K. G. 2015, A&A, 578, A101 [NASA ADS] [CrossRef] [EDP Sciences] [Google Scholar]
- Lanza, A. F. 2010, in Solar and Stellar Variability: Impact on Earth and Planets, eds. A. G. Kosovichev, A. H. Andrei, & J. P. Rozelot, IAU Symp., 264, 120 [Google Scholar]
- Li, X.-F., Shi, J.-R., Li, Y., Yan, H.-L., & Zhang, J.-H. 2024, MNRAS, 529, 1423 [NASA ADS] [CrossRef] [Google Scholar]
- Marsden, S. C., Berdyugina, S. V., Donati, J. F., Eaton, J. A., & Williamson, M. H. 2007, Astron. Nachr., 328, 1047 [Google Scholar]
- Montes, D., de Castro, E., Fernandez-Figueroa, M. J., & Cornide, M. 1995, A&AS, 114, 287 [NASA ADS] [Google Scholar]
- Montes, D., Fernandez-Figueroa, M. J., de Castro, E., & Sanz-Forcada, J. 1997, A&AS, 125, 263 [NASA ADS] [CrossRef] [EDP Sciences] [Google Scholar]
- Nolthenius, R. 1991, Inf. Bull. Var. Stars, 3589, 1 [Google Scholar]
- Oláh, K. 2006, Ap&SS, 304, 145 [Google Scholar]
- Oláh, K., Jurcsik, J., & Strassmeier, K. G. 2003, A&A, 410, 685 [NASA ADS] [CrossRef] [EDP Sciences] [Google Scholar]
- Oláh, K., Kolláth, Z., Granzer, T., et al. 2009, A&A, 501, 703 [NASA ADS] [CrossRef] [EDP Sciences] [Google Scholar]
- Oláh, K., Moór, A., Kővári, Z., et al. 2014, A&A, 572, A94 [NASA ADS] [CrossRef] [EDP Sciences] [Google Scholar]
- Özdarcan, O., Carroll, T. A., Künstler, A., et al. 2016, A&A, 593, A123 [NASA ADS] [CrossRef] [EDP Sciences] [Google Scholar]
- Petit, P., Donati, J. F., Wade, G. A., et al. 2004, MNRAS, 348, 1175 [NASA ADS] [CrossRef] [Google Scholar]
- Pettersen, B. R., Hawley, S. L., & Fisher, G. H. 1992, Sol. Phys., 142, 197 [Google Scholar]
- Roettenbacher, R. M., Monnier, J. D., Korhonen, H., et al. 2016, Nature, 533, 217 [Google Scholar]
- Spiegel, E. A. 2009, Space Sci. Rev., 144, 25 [Google Scholar]
- Spruit, H. C., & Weiss, A. 1986, A&A, 166, 167 [NASA ADS] [Google Scholar]
- Strassmeier, K. G. 1999, A&A, 347, 225 [NASA ADS] [Google Scholar]
- Strassmeier, K. G., & Oláh, K. 1992, A&A, 259, 595 [Google Scholar]
- Strassmeier, K. G., Hall, D. S., Zeilik, M., et al. 1988, A&AS, 72, 291 [NASA ADS] [Google Scholar]
- Strassmeier, K. G., Fekel, F. C., Bopp, B. W., Dempsey, R. C., & Henry, G. W. 1990, ApJS, 72, 191 [NASA ADS] [CrossRef] [Google Scholar]
- Strassmeier, K. G., Bartus, J., Cutispoto, G., & Rodono, M. 1997, A&AS, 125, 11 [NASA ADS] [CrossRef] [EDP Sciences] [Google Scholar]
- Strassmeier, K. G., Kővári, Zs., Weber, M., & Granzer, T. 2024, Nat. Commun., 15, 9986 (Paper I) [Google Scholar]
- Vogt, S. S., Hatzes, A. P., Misch, A. A., & Kürster, M. 1999, ApJS, 121, 547 [Google Scholar]
- Weber, M. 2007, Astron. Nachr., 328, 1075 [Google Scholar]
- Worthey, G., & Lee, H.-C. 2011, ApJS, 193, 1 [CrossRef] [Google Scholar]
- Xiang, Y., Gu, S., Collier Cameron, A., Barnes, J. R., & Cao, D. 2024, ApJ, 976, 217 [Google Scholar]
- Zellem, R., Guinan, E. F., Messina, S., et al. 2010, PASP, 122, 670 [Google Scholar]
Appendix A: Lomb-Scargle periodograms
In connection with Fig. 2 and Table 2, we present here the Lomb-Scargle periodograms obtained for the entire V data set (see Fig. A.1) and the four sub-seasons (see Fig. A.2). We note that the amplitudes of the periodograms presented here do not necessarily match the final values in Table 2, as those in the table were derived from the successive uses of the MuFrAn code (see Sect. 3), in which the next period search was always performed on the spectrum prewhitened by the previously found dominant period. Nevertheless, the locations of the relevant Lomb-Scargle peaks agree well with the corresponding period values in Table 2.
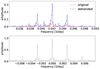 |
Fig. A.1. Top: Part of the Lomb-Scargle periodogram for the entire V data showing the rotation-related periods. The highest peak of the main lobe corresponds to the strongest period of ≈23.78 d, the other two large lateral ones (and the other much smaller ones) are side lobes from windowing. Bottom: The corresponding window function. |
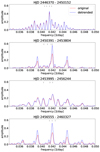 |
Fig. A.2. The rotation-related parts of the Lomb-scargle periodograms obtained for the four sub-seasons; see also Fig. 2. The ticks at the top of each panel are the locations of the periods listed in Table 2. |
All Tables
All Figures
|
Fig. 1. Combined V, B − V and V − IC data of XX Tri that we used in this paper. |
| In the text | |
|
Fig. 2. Rotational periods of XX Tri for four segments of V dataset. The orbital period is indicated with a dashed line. The dots marking the detected rotational signals of each segment are coloured according to their Fourier amplitudes (see also Table 2). |
| In the text | |
|
Fig. 3. Time-frequency plot of long-term variability of XX Tri over four decades using STFT (lower left panel) and CWD (lower right panel) kernels. In the two upper (in this case identical) panels, the blue dots show the original V magnitudes, and the blue line shows their spline fit, while the red dots represent the data cleaned of the rotational signal, and the red line represents the corresponding spline fit. |
| In the text | |
|
Fig. 5. Left, from top to bottom: B, V, and IC data used for temperature determinations. In the middle panel showing V data, points measured simultaneously with B measurements are marked in light blue, and points measured simultaneously with IC measurements are marked in light red. Right: Enlarged view around discrepant V (upper panel) and V − IC (lower panel) data; data points corrected by 0 |
| In the text | |
|
Fig. 4. Time-frequency plot of long-term variability of XX Tri over nearly four decades in B − V (left panels) and V − IC colour indices (right panels). Otherwise, as in Fig. 3. |
| In the text | |
|
Fig. 6. Comparison of overall stellar temperature variations derived from STELLA spectra used in Paper I (green crosses) and from B − V (blue dots) and V − IC colour indices (red dots). |
| In the text | |
|
Fig. 8. Change of location of XX Tri on HRD due to temperature variation derived from B − V (bluish shades) and V − IC (reddish shades). The passage of time is indicated by the colour scales on the side. |
| In the text | |
|
Fig. 7. Variability over 16 years’ of spectroscopically determined effective temperature of XX Tri taken from Paper I. Otherwise, as in Fig. 3. |
| In the text | |
|
Fig. 9. Longitudes of activity centres derived from 16 years’ of time-series Doppler images. We identified two or three activity centres per image. The larger the dot size, the more dominant the active longitude. Vertical grey bars indicate the separate observing seasons. |
| In the text | |
|
Fig. 10. Grand average of cross-correlation function maps obtained from ACCORD. The map indicates how much longitude shift occurs at a given latitude due to surface shear over 35 days (the median time interval between successive Doppler maps). The solid line is a Sun-like differential rotation fit with a shear coefficient of α = 0.014. |
| In the text | |
|
Fig. A.1. Top: Part of the Lomb-Scargle periodogram for the entire V data showing the rotation-related periods. The highest peak of the main lobe corresponds to the strongest period of ≈23.78 d, the other two large lateral ones (and the other much smaller ones) are side lobes from windowing. Bottom: The corresponding window function. |
| In the text | |
|
Fig. A.2. The rotation-related parts of the Lomb-scargle periodograms obtained for the four sub-seasons; see also Fig. 2. The ticks at the top of each panel are the locations of the periods listed in Table 2. |
| In the text | |
Current usage metrics show cumulative count of Article Views (full-text article views including HTML views, PDF and ePub downloads, according to the available data) and Abstracts Views on Vision4Press platform.
Data correspond to usage on the plateform after 2015. The current usage metrics is available 48-96 hours after online publication and is updated daily on week days.
Initial download of the metrics may take a while.